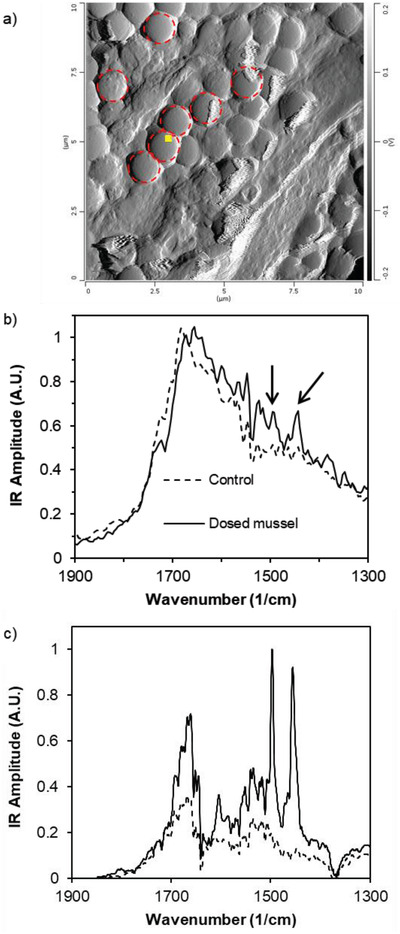
Figure 4.

a) AFM deflection image of 1000 nm PS beads in a siphon from a quagga mussel dosed with beads at 1 × 10⁻¹² m (see Figure S7, Supporting Information, for AFM images of undosed mussel siphons). The small yellow square indicates where the AFM‐IR spectrum was acquired. Dotted red circles highlight representative PS beads; b) AFM‐IR spectra comparing mussel siphon with PS beads and control siphon. Distinctive PS peaks at 1452 and 1492 cm−1 are evident in the spectrum of the dosed mussel (indicated with arrows); c) mIRage IR spectrum of a mussel siphon embedded with PS beads. The solid line corresponds to a region of the siphon with PS beads. The distinctive PS signals at 1452 and 1492 cm−1 are obvious. The dashed line corresponds to a region of the siphon with no PS beads.
