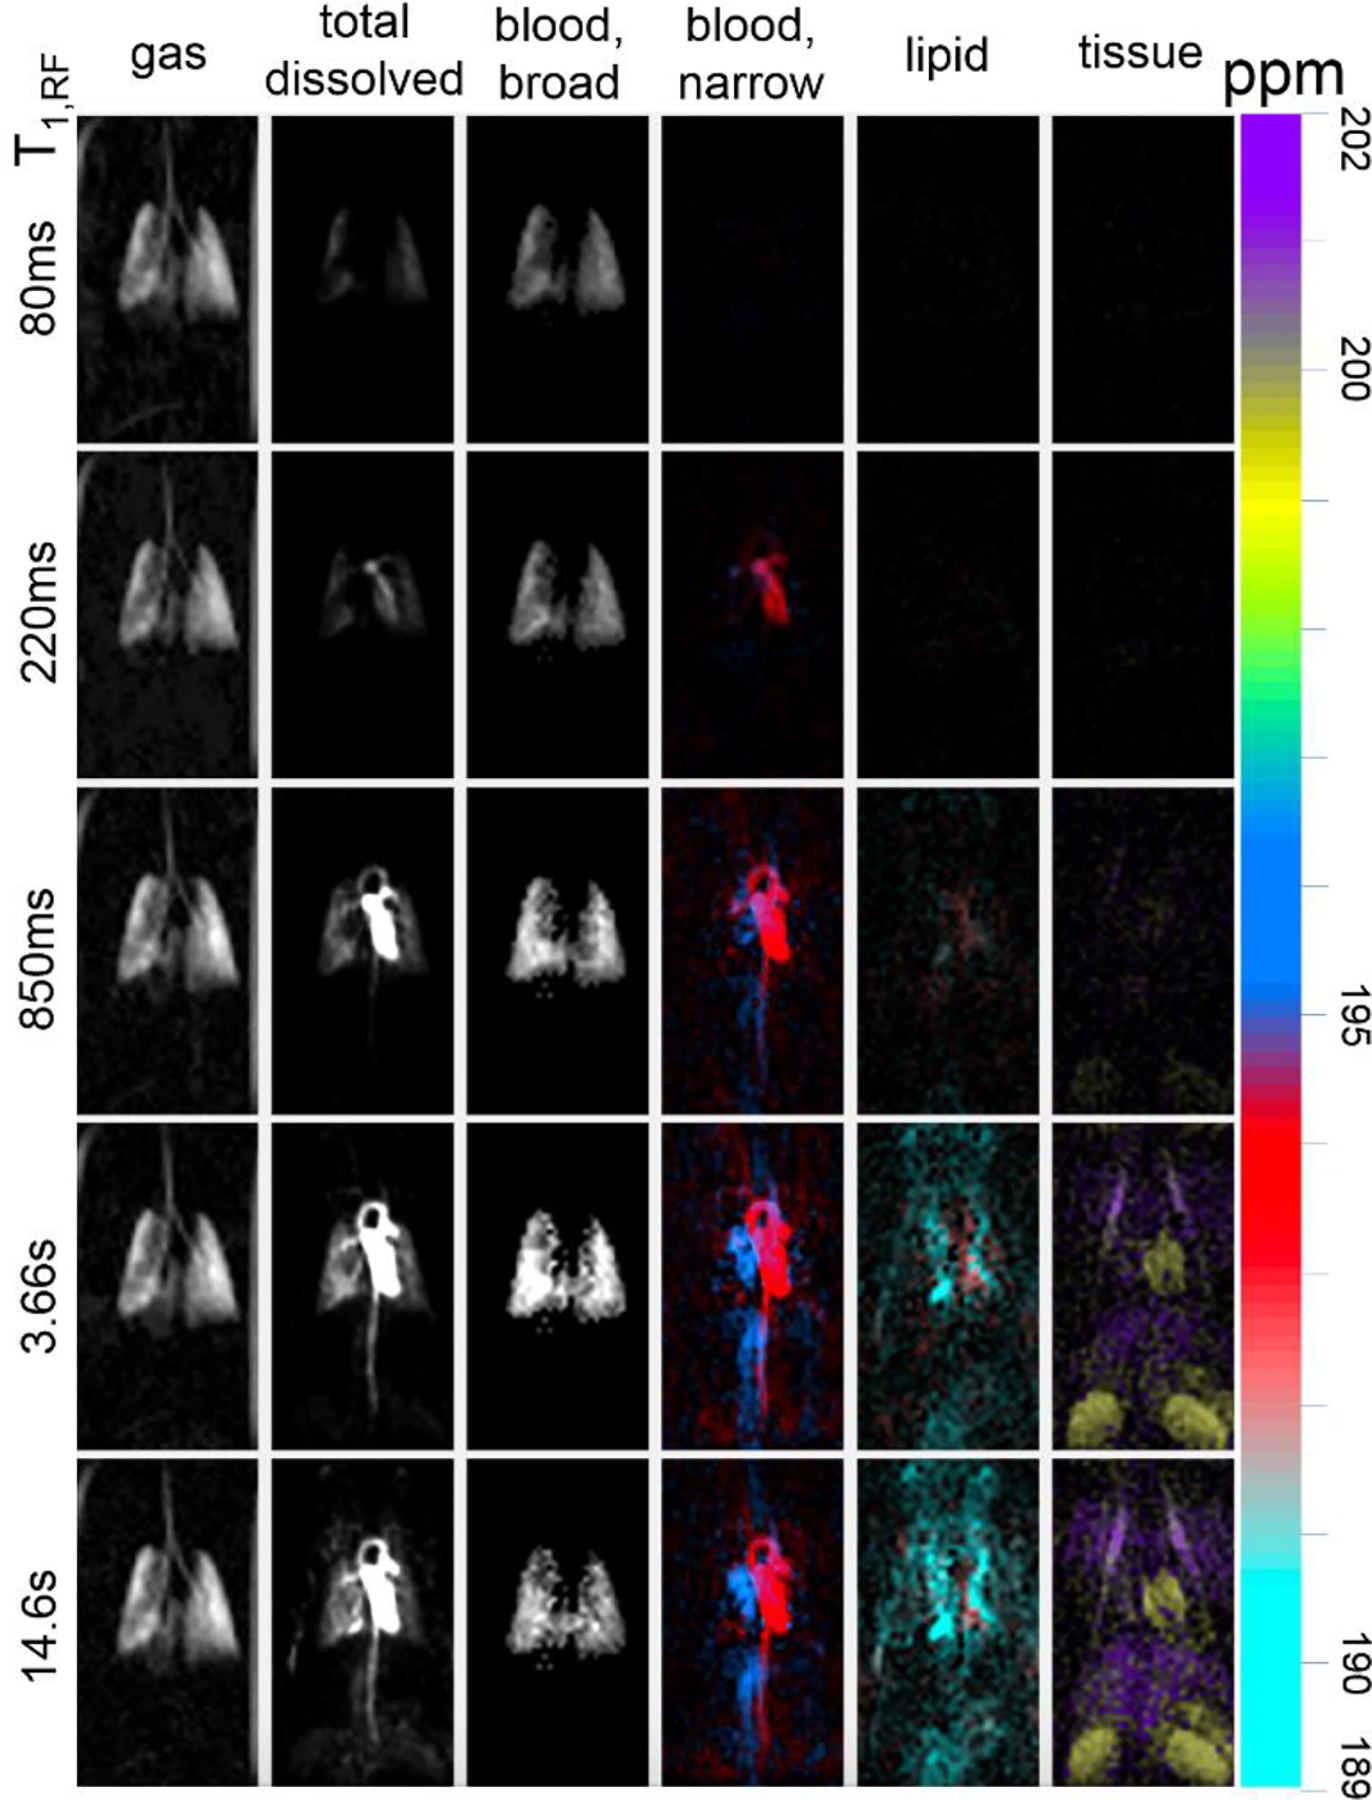
Fig. 8.

Distinct “compartmental” features along the circulatory system can be visualized by integrating under respective DP linewidth peaks. T1,RF times (left) correspond to how long 129Xe magnetization persists in the body and, consequently, how far within the body it travels. The large range in chemical shifts associated with DP 129Xe entering distinct anatomical compartments is visualized in individual, color-coded maps.
