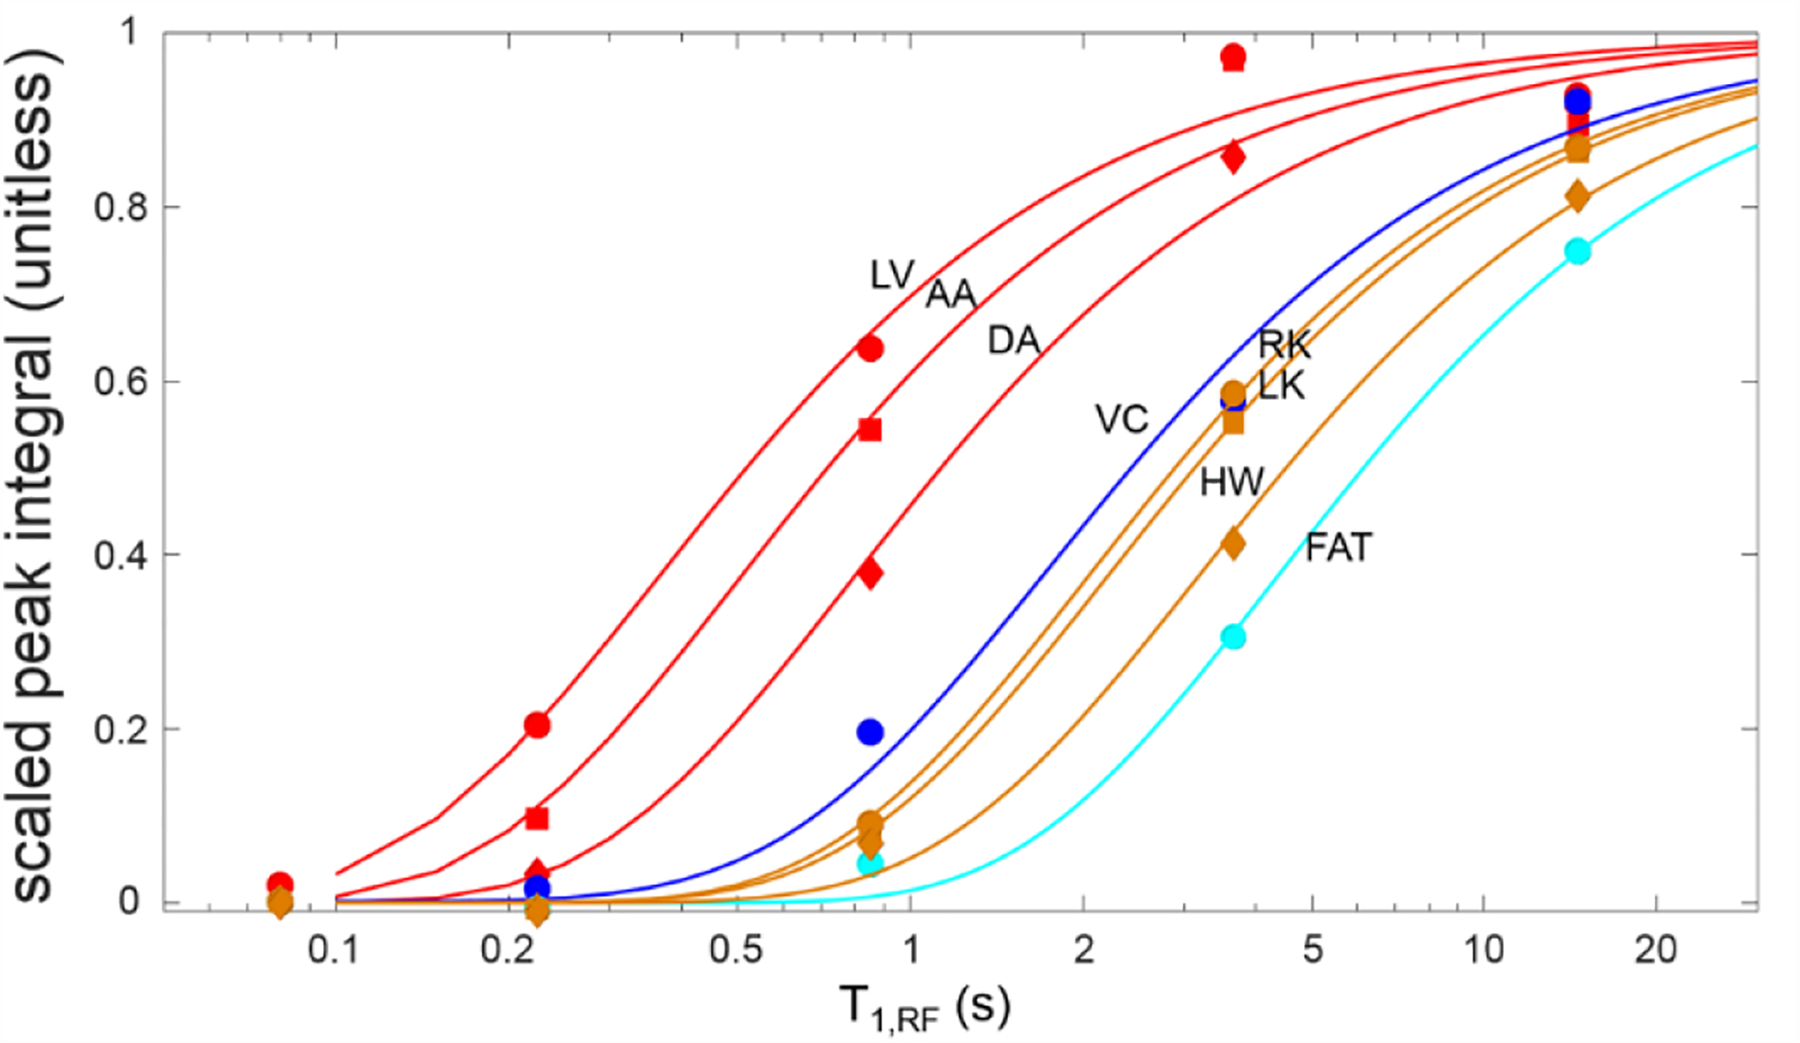
Fig. 9.

Quantification of magnetization buildup in the left ventricle (red circles, = 360 ms), aortic arch (red squares, = 490 ms), descending aorta (red diamonds, = 790 ms), vena cava (blue circles, = 1.7 s), left and right kidneys (ochre squares and circles, = 2.2 s and 2.0 s, respectively), heart wall (ochre diamonds, = 3.2 s) and lipid-rich regions (cyan circles, = 4.8 s). The lines indicate fits to the two-parameter model of gas dissolution duration of (5) and (6). All spectral peak integrals are scaled to the saturation value indicated by the fit. Note that the dissolved gas can be seen in the heart even with a very short T1,RF, indicating a rapid arrival in accordance with accepted physiological understanding. Arrival in more distal vascular structures indicates the rate at which blood is transported after leaving the heart, and arrival/saturation of organ tissues mirrors the relatively slow saturation by oxygen or other dissolved gases.
