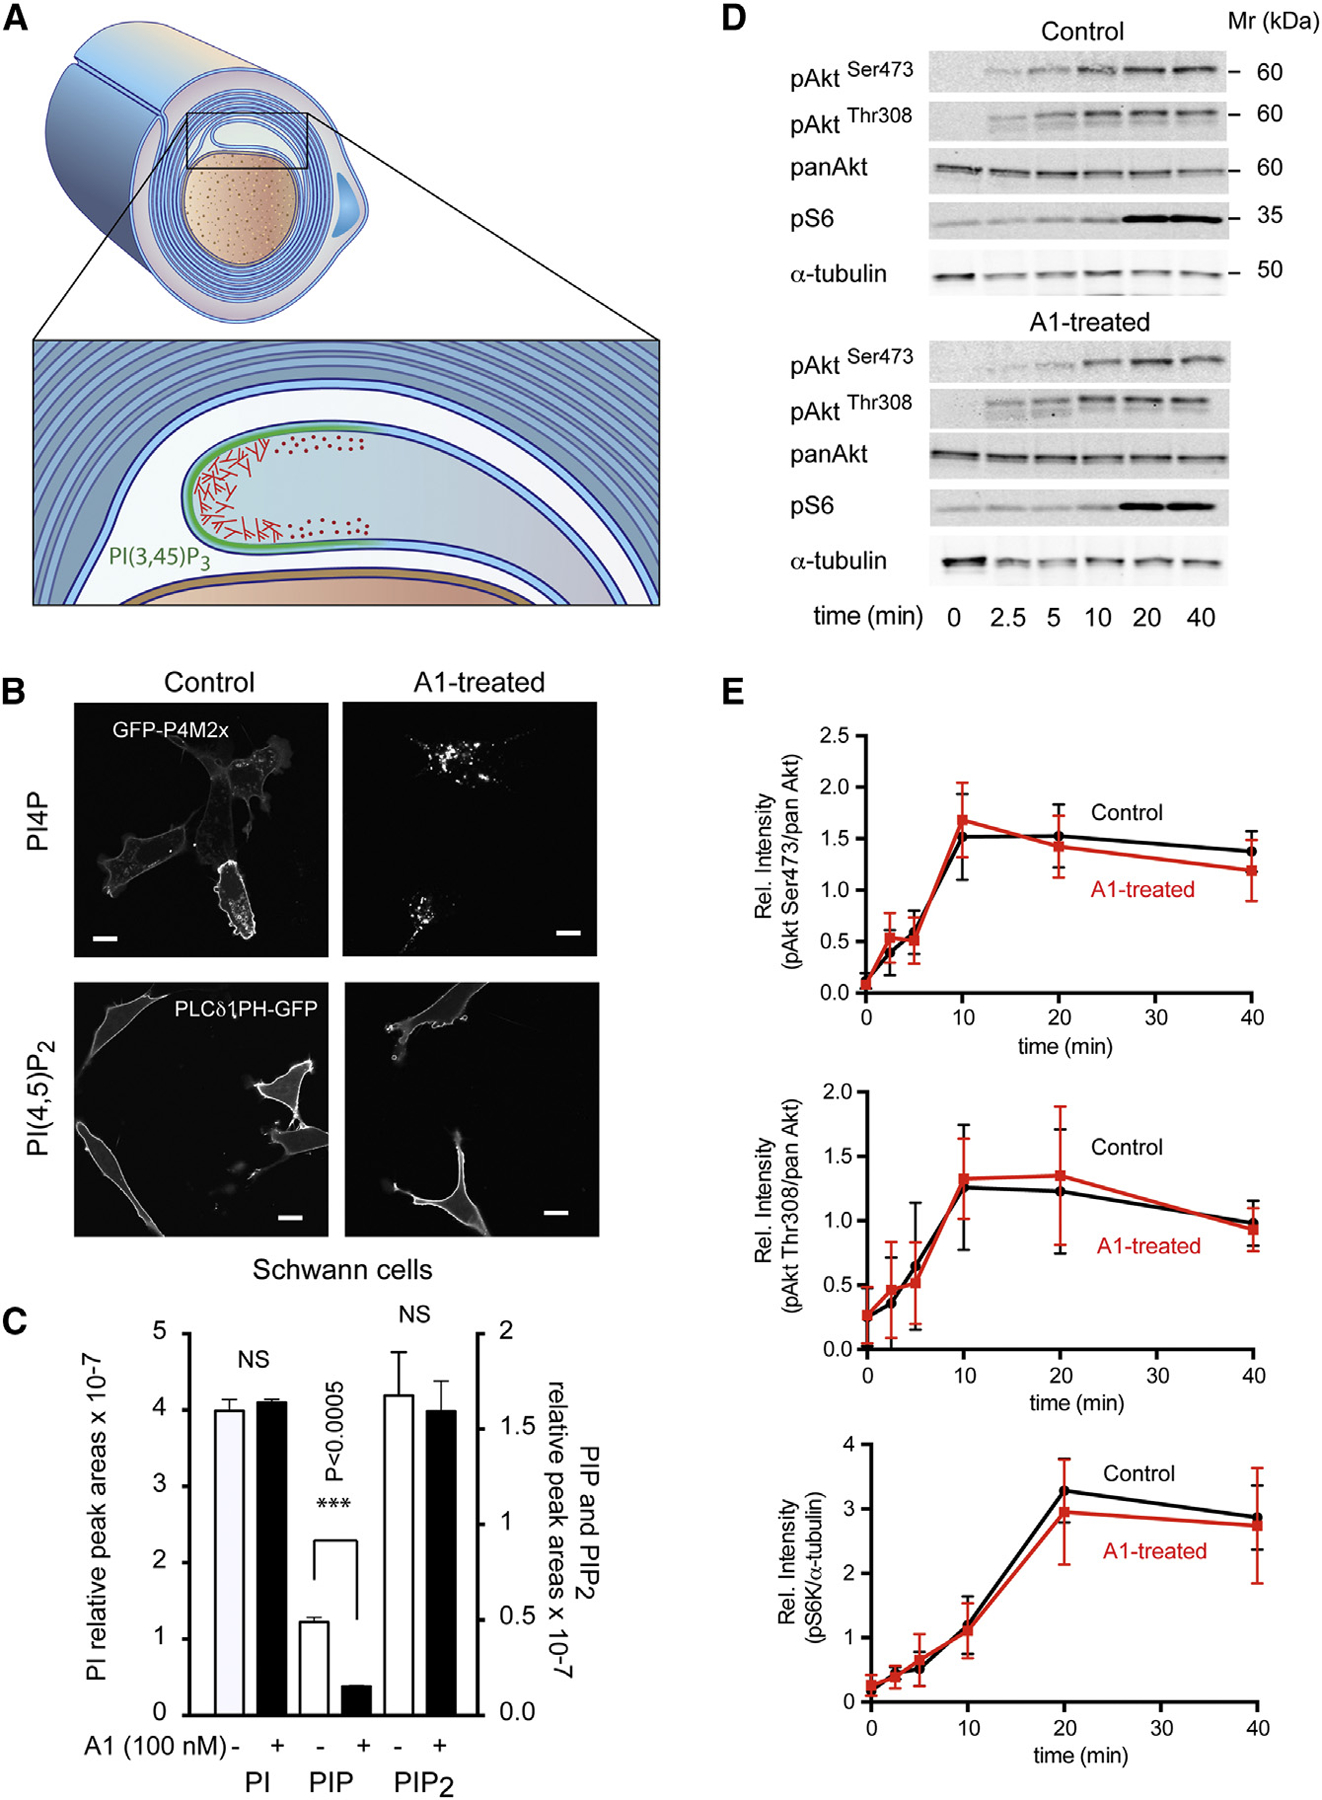
Figure 3. PI(4,5)P2 Levels and PI3K/Akt/ mTOR Responses to Serum Stimulation Are Unchanged in a Mouse SC Line after Prolonged Inhibition of PI4KA.

(A) Cartoon showing the growing myelin sheaths around a myelinated axon. This process requires both PI3K activation (green) and actin dynamics with proper spatial control (red).
(B) A mouse SC line (SW10) was treated with the PI4KA inhibitor (A1; 100 nM) for 24 hr, and PI(4,5)P2 and PI4P localization was assessed by expressing the lipid reporters, PLCδ1-PH-GFP and GFP-P4M2x, respectively. A1 treatment causes a major decrease in PM PI4P levels, causing the PI4P reporter probe to re-localize to endosomes and the Golgi, where PI4P levels remain unaffected (lower right panel). The same treatment did not reduce PI(4,5)P2 levels, and the reporter remains on thePM (left-lower panel). The scale bars represent 10 μm.
(C) Lipidomic analysis of phosphoinositides from cells treated with 100 nM A1 or DMSO for 24 hr. Note the massive reduction in the absolute amount of PIP (***p < 0.0005; unpaired t test) and the lack of significant change in PIP2 (means ± SEM; from triplicate samples).
(D) WB analysis of different downstream effectors of the PI3K/Akt/mTOR pathway (AktSer473, AktThr308, and pS6 ribosomal protein) showed similar kinetics of phosphorylation after stimulation with 10% serum following prolonged treatment with the PI4KA inhibitor or DMSO (control).(E) Quantification from three such experiments (means ± SEM; n = 3).
