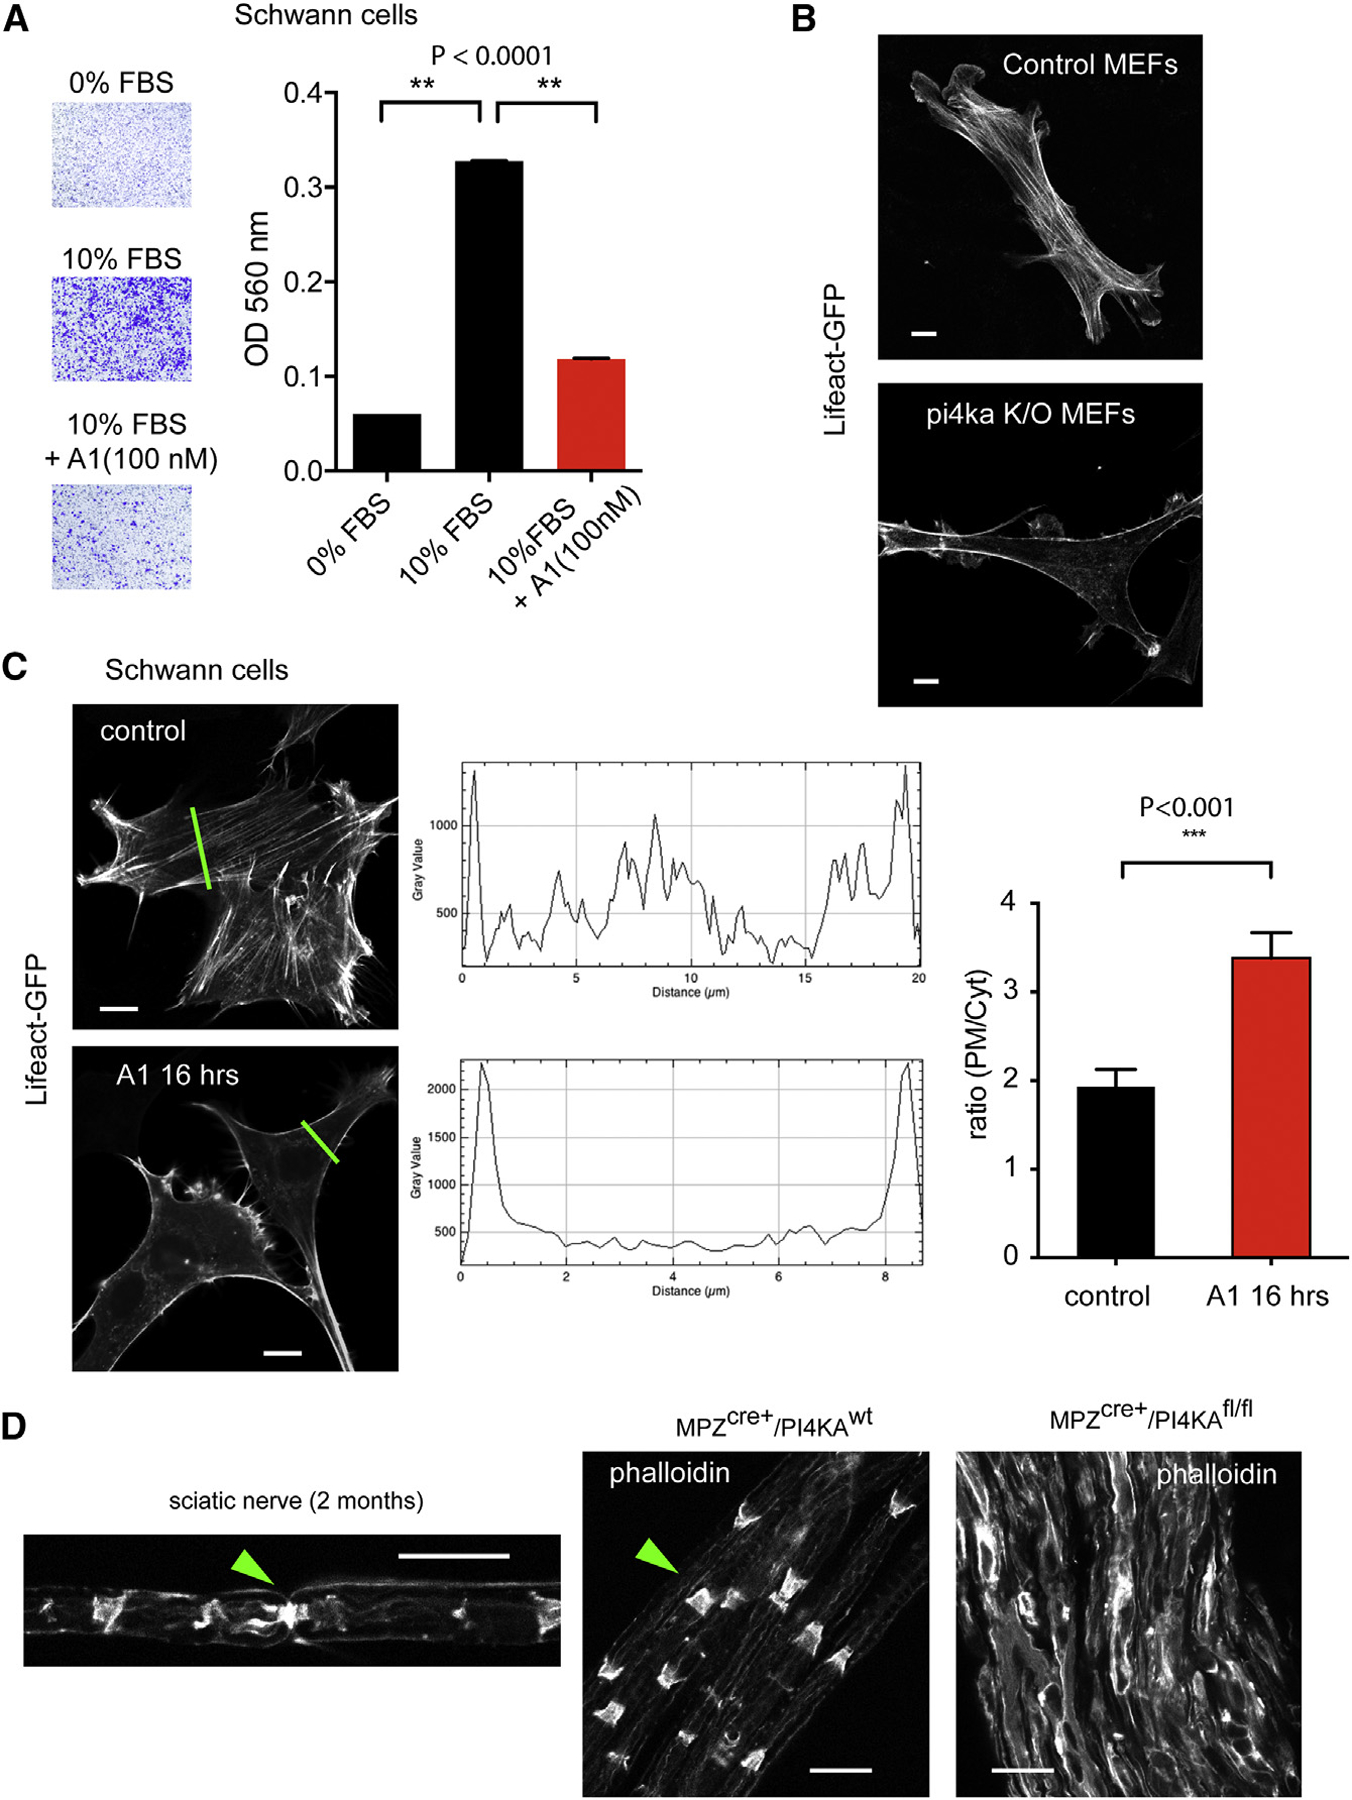
Figure 4. PI4KA Inactivation Affects Cell Migration and Actin Distribution.

(A) Migration of SW10 cells in Boyden chambers in response to serum. Treatment of cells with A1 (100 nM; during the whole migration time of 24 hr) significantly reduced the number of cells migrating toward the serum-containing medium. Means ± SEM; n = 3 (**p < 0.0001).
(B) Immortalized MEF cells expressing LifeAct-GFP. Immortalized MEF cells prepared from PI4Kfl/fl/R26ERCre+ embryos (Bojjireddy et al., 2014) were treated with tamoxifen or solvent as described under Materials and Methods before transfection with the LifeAct-GFP and confocal microscopy. Representative pictures show the prominent lack of stress fibers and more pronounced cortical actin in the cells with PI4KA deletion compared to controls. The scale bars represent 10 μm.
(C) Prolonged (16-hr) inhibition of PI4KA in SW10 cells shows reduced stress fibers. Line intensity histograms were analyzed to assess the redistribution of F-actin as shown in representative examples (green lines; scale bars: 10 μm). Such analysis of 10 cells showed a significant increase in the plasma membrane intensities relative to the average cytoplasmic signal. ***p < 0.001.
(D) Phalloidin staining of teased sciatic nerves obtained from control or mutant mice. Note the degraded actin organization and strong actin staining in the mutant nerves. Green arrow in the left panel shows the actin structure at a node of Ranvier, whereas in the middle panel, it shows Schmidt-Lanterman incisures (SLIs). The scale bars represent 20 μm.
