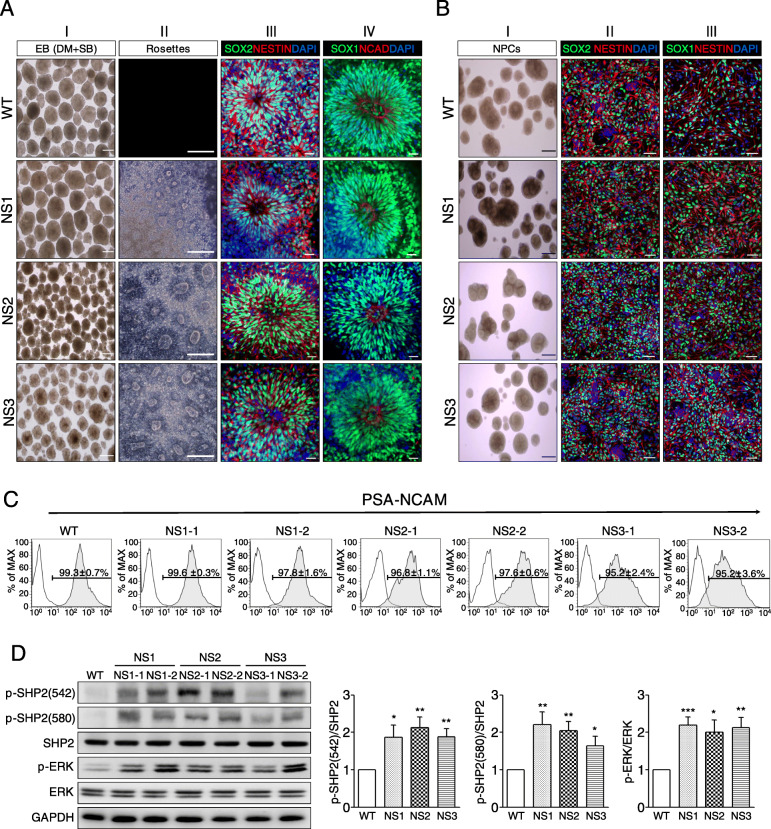
Fig. 2.
Effects of inhibited BMP and TGF-β pathways on EB formation in the NS-iPSCs. a Morphological recovery and NR develoment of NS-EBs by inhibition of both the BMP and TGF-β signaling pathways. Abnormal NS-EBs were ameliorated by treatment of BMP and TGF-β inhibitors (panel I). Similar to the WT-NRs, the NS-NRs had normal rosette structures (panel II) and expressed NR markers (panels III and IV). Scale bars, 100 μm (bright field images) and 20 μm (fluorescence images). b Normal development of NS-NRs to NPCs. Similar to the WT-NPCs, the NS-NPCs showed normal morphologies (panel I) and expressed neuroectodermal markers, such as SOX1, SOX2, and NESTIN (panel II and III). Scale bars, 500 μm (bright field images) and 50 μm (fluorescence images). c Immunofluorescence analyses of NS-NPCs with an immature neural marker, PSA-NCAM. The WT-NPCs and NS-NPCs showed a high proportion (more than 95%, n = 3) of PSA-NCAM positives (bottom). Black and tinted gray lines indicate the isotype control and PSA-NCAM, respectively. d Increased levels of p-SHP2 and p-ERK in the NS-NPCs. Western blot analysis showed that the levels of p-SHP2 and p-ERK were increased in the NS-NPCs compared with the WT-NPCs. The relative band intensities are presented as the mean ± SEM (n = 5). p values were determined using an unpaired Student’s t test. *p < 0.05, **p < 0.01, ***p < 0.001. Abbreviation: WT, wild-type; NS, Noonan syndrome; DM, dorsomorphin; SB, SB431542; PSA-CAM, polysialic-acid neural cell adhesion molecule

