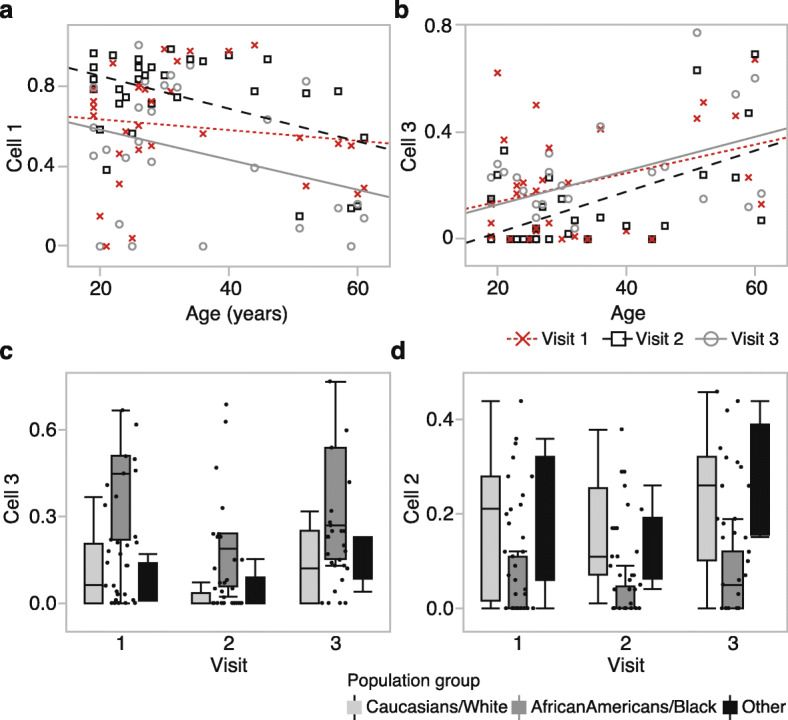
Fig. 3.

Estimated cell-type proportions and associated variables. a Cell 1 shows both longitudinal and cross-sectional variability. The proportion of cell 1 is negatively correlated with age at visit 2 (r = − 0.48, p value = 0.006, n = 31; black squares and dashed line), but not at visit 1 (r = − 0.13, p value = 0.49, n = 31; red × markers and dotted line), and only slightly at visit 3 (r = − 0.32, p value = 0.10, n = 27; gray circles and solid line). b Cell 3 is associated with cross-sectional variability but no significant longitudinal change. The estimated proportion has a strong positive correlation with age at all three visits. At visit 1, r = 0.36 (p value = 0.05); visit 2, r = 0.57 (p value = 0.0009); visit 3, r = 0.48 (p value = 0.01). c Cell 3 also shows a significantly higher proportion in African-Americans at all three visits (F2,28 = 15.66, p value < 0.0001 at visit 1). d Cell 2 is also ethnicity-specific and associated with a lower proportion in African-Americans at all three visits (F2,28 = 4.77, p value < 0.02 at visit 1)
