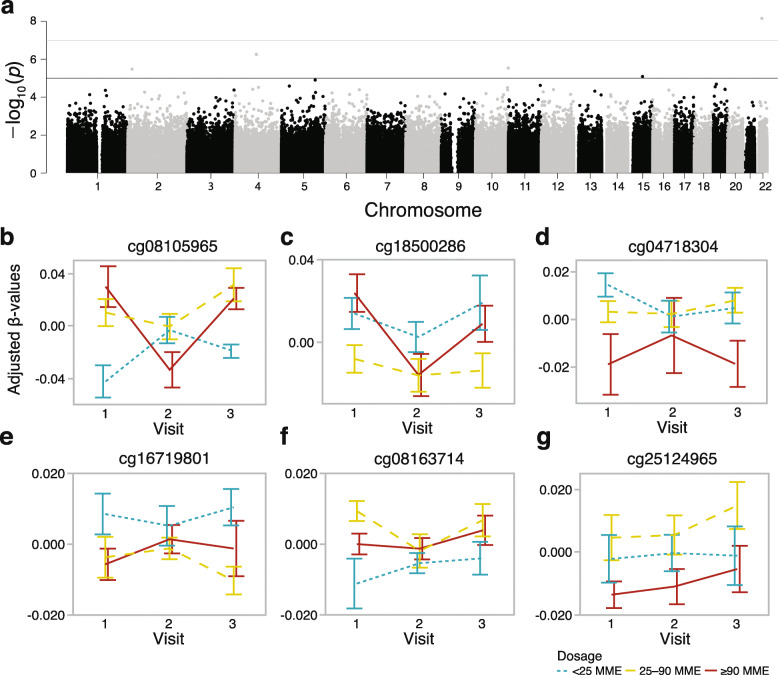
Fig. 5.
Epigenome-wide test for prescription opioid dosage. a The epigenome-wide Manhattan plot depicts the location of each CpG (autosomal chromosomes 1 to 22 on the x-axis) and the –log10(p value) for the effect of doage (y-axis). The genome-wide significant threshold was set at p value = 5 × 10⁻⁸ (upper red horizontal line); the suggestive threshold was set at p value = 10-5 (lower blue horizontal line). For the six CpG sites that were above the genome-wide suggestive threshold, residual β values were extracted after fitting participant ID as random intercept, and the plots show the methylation patterns across the three visits (error bars are standard error) for b cg08105965 (RASL10A), c cg18500286 (AFF1), d cg04718304 (intergenic), e cg16719801 (VSNL1), f cg08163714 (ANXA2), and g cg25124965 (PAIP2). For most of these, the difference between the dosage groups appears at visits 1 and 3

