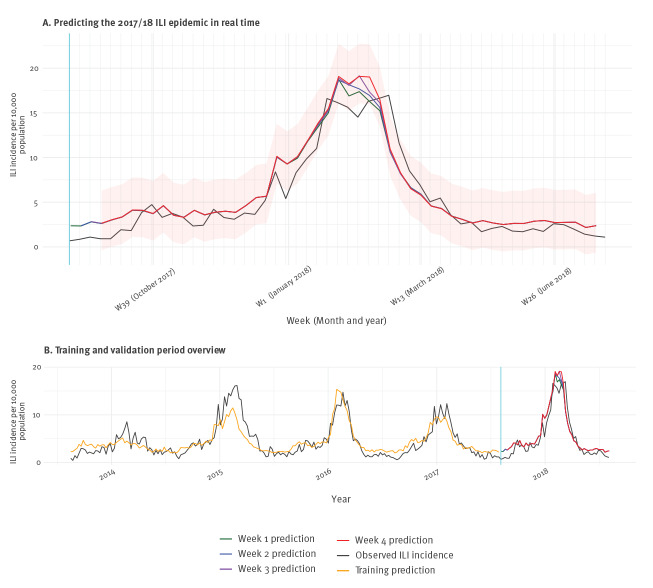
Figure 2.
Time series plot showing observed influenza-like illness incidence against predictions of 52 final lasso regression models, weeks 31/2017–31/2018 (A) and overview of training and validation, weeks 33/2013–31/2018 (B), Netherlands
ILI: influenza-like illness.
For the validation period (top), each model provides estimates for the week in which it was run (week 4) and the previous 3 weeks (week 3 to 1). The red shaded area shows the empirical 95% prediction interval for week 4 predictions. In addition, predicted values within the training set are provided for the first lasso regression model (bottom).

