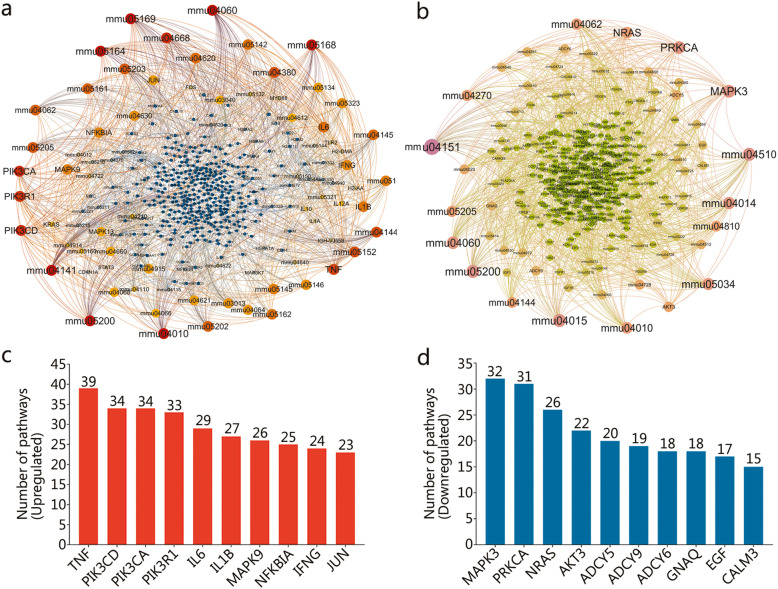
Fig. 8.
Network map of DE genes associated with upregulated or downregulated pathways. The network map of DE genes associated with upregulated a or downregulated b pathways was made by Gehpi software. The pathways were showed as pathway ID such as mmu05168. The color and diameter of each circle represent the degree of enrichment of the genes or pathways, the larger diameter, and redder or pinker color indicate the more upregulated or downregulated pathways the gene involved. In addition, the top 10 genes of upregulated c or downregulated d pathways were also identified

