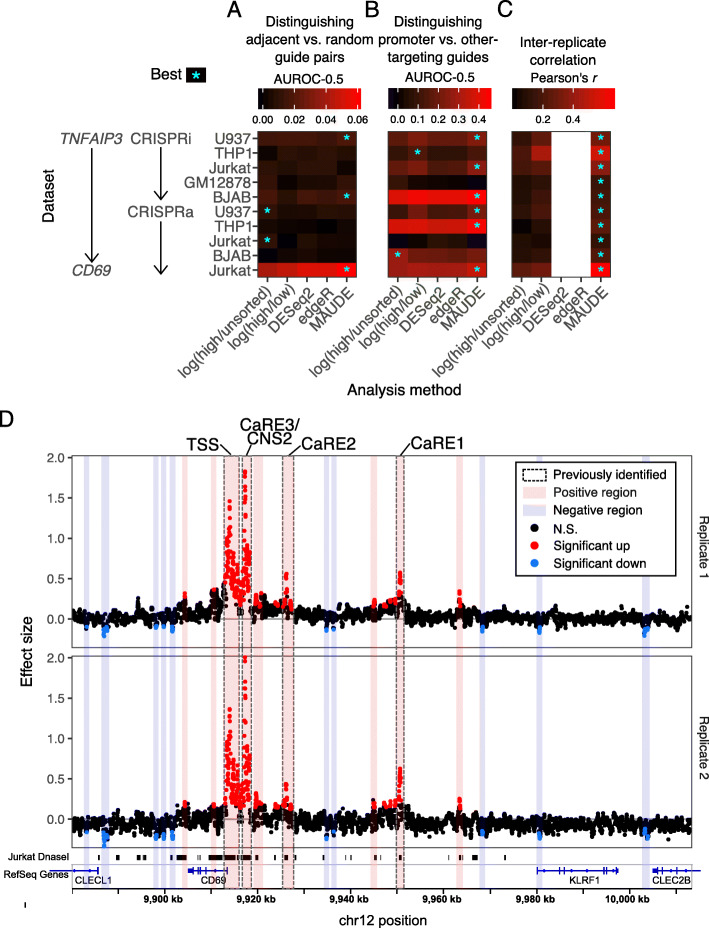
Fig. 3.
MAUDE outperforms other methods and yields insight into CD69 regulation. a–c MAUDE outperforms other methods by three criteria. Comparison between methods (x axes) in the analysis of CRISPRi and CRISPRa screens (y axis), including TNFAIP3 RNA expression-based screens [16] and a CD69 CRISPRa protein expression-based tiling screen [9]. We evaluated the performance of each method on each dataset (color; higher values correspond to better performance) and indicated the best performing approach for each dataset and criterion with an asterisk (only indicated in cases where one or more methods had a statistically significant performance (P < 0.01 for rank sum test (a, b) or Pearson’s correlation (c))). Three evaluation criteria were used: a relative similarity in effect sizes of adjacent guides (compared to randomly selected pairs of guides, by AUROC), (b) ability to distinguish promoter-targeting guides from other targeting guides, and (c) Pearson’s correlation between the effect size estimates of both replicates. Correlation between replicates was not possible for edgeR or DESeq2 as they combine replicates to estimate effect sizes and statistics. d Reanalysis of CD69 CRISPRa screen data with MAUDE’s sliding window approach highlights additional plausible regulatory elements. Effect size (y axes) vs. genomic position (x axis) for two replicates (top and bottom), with elements (points) colored by those that significantly increased (red) or decreased (blue) expression of CD69 and those that did not (black). Bottom: gene annotations (blue) and Jurkat DNaseI hypersensitivity (black). Vertical bars: clusters of significant elements identified by MAUDE—regions that increase CD69 expression (red) and regions that decrease CD69 expression (blue), with previously identified regions indicated (gray border)

