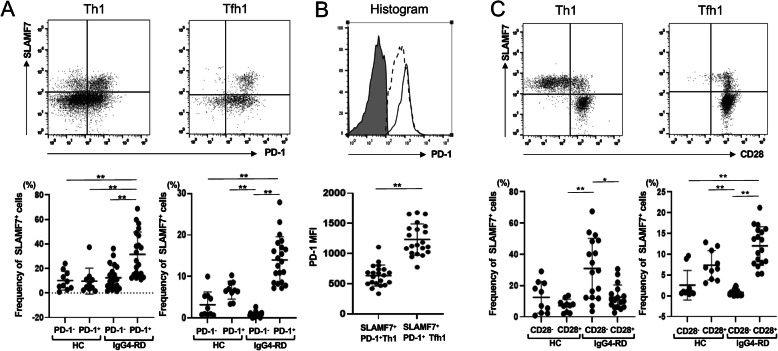
Fig. 3.
Expression levels of PD-1 and CD28 in SLAMF7+ Tfh1 and Th1 cells in patients with IgG4-RD. a Comparison of the frequency of SLAMF7+ fraction of Th1 and Tfh1 cells in HCs and patients with IgG4-RD in the absence or presence of PD-1. b Comparison of PD-1 expression levels on Th1 and Tfh1 cells in IgG4-RD patients (shadow: isotype control, dotted line: PD-1 in SLAMF7+PD-1+Th1 cells, solid line: PD-1 in SLAMF7+PD-1+Tfh1 cells). c Comparison of the frequency of SLAMF7+ fraction of Th1 and Tfh1 cells in HCs and patients with IgG4-RD in the absence or presence of CD28. * indicates p < 0.05, ** indicates p < 0.01

