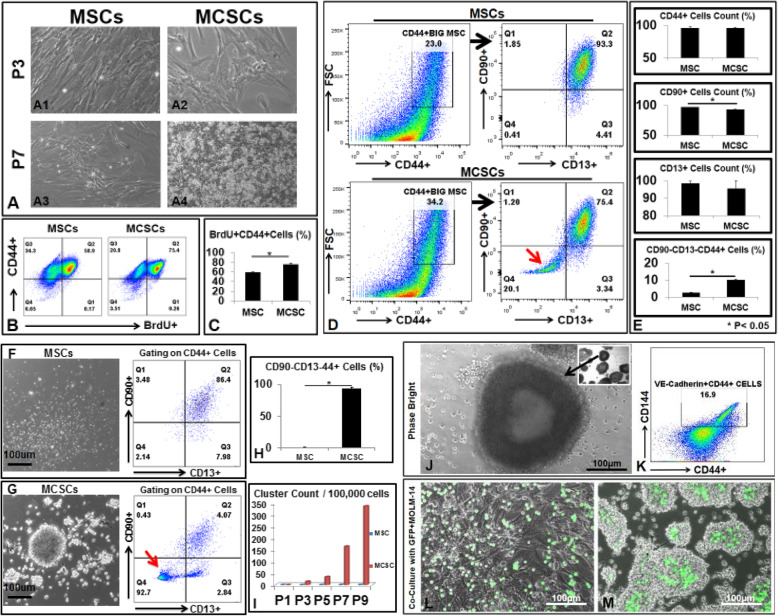
Fig. 1.
Isolation and expansion of CD90-CD13-CD44+MCSCs from an AML patient bone marrow ex vivo. a Phase bright images of MSCs and MCSCs at different passages (P). b 24 h after culturing cells with BrdU, P7 MSCs, and P7 MCSCs were collected and analyzed by FACS for incorporation of BrdU. c Aggregate data showing percentage of BrdU+CD44+ cells in MSCs and MCSCs. d P3 MSCs and P3 MCSCs were analyzed by FACS for immunophenotype. Thick black arrows indicate gating strategy. The red arrow indicates the population of CD90-CD13-CD44+ cells. e Aggregate FACS data showing the percentage of MSCs and MCSCs positive for each biomarker. f Left: Phase bright image of floating cells from P5 MSC culture. Right: P5 MSCs were collected and analyzed by FACS. g Left: Phase bright image of floating cells from P5 MCSC culture. Right: P5 MCSCs were collected and analyzed by FACS. The red arrow indicates CD90-CD13-CD44+ cells. hAggregate FACS data showing the percentage of CD90-CD13-CD44+ cells comprising the floating cell populations from MSCs and MCSCs. iCumulative counts of clusters generated from MSC and MCSC cultures over time. j Inset: phase bright images of floating tube-like structure from P8 MCSC culture. Black thick arrows indicate the same round tube at × 2 and × 10 magnification. k P8 Floating MCSCs were analyzed by FACS for endothelial cell markers such as VE-Cadherin (CD144). l Phase bright image of GFP+MOLM-14 cells cultured with MSCs after 24-h plating. m Phase bright image of GFP+MOLM-14 cells co-cultured with MCSCs after 24-h plating. Where applicable, data are means ± SEM from each group and were analyzed by Student t test. *p < 0.05; N=3. Scale bar 100 μm

