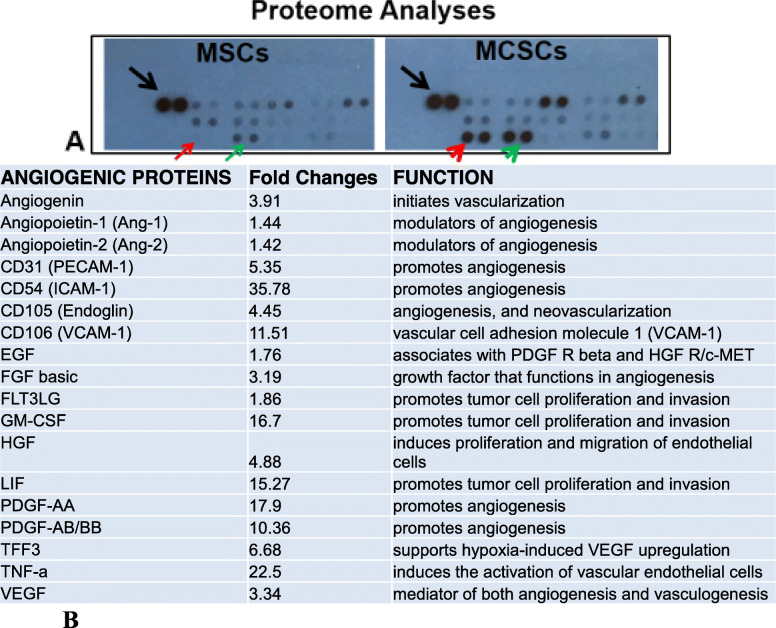
Fig. 2.
Proteome analyses indicate the significant increase in angiogenic protein release from MCSC cultures. a Image of partial blot films developed for proteome analyses. The black arrow indicates the control dots from the manufacturer. The red arrow indicates no protein expression. The red arrowhead indicates protein expression at the same location in the film. The green arrow indicates weak protein expression. The green arrowhead indicates strong protein expression at the same location. Note: each antibody has two dot spots according to manufacturer’s specification. b Proteome comparison (fold change) of angiogenic proteins between supernatants from P7 MSC and P7 MCSC cultures. Fold Changes represent MCSCs versus MSCs

