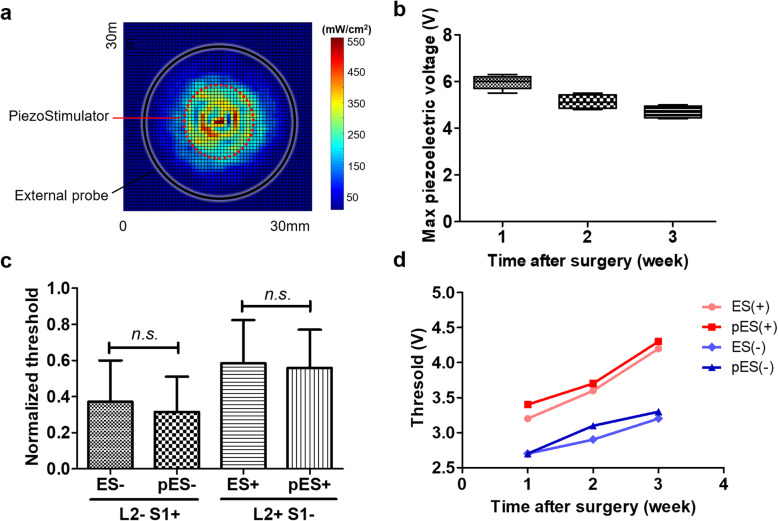
Fig. 2.
a Under PRF of 1 kHz, acoustic intensity-distributing map of the external ultrasound probe measured at a distance of 4 mm from its surface. The black circle indicates the size of ultrasound probe, and the red dotted circle indicates the size of the implanted piezoelectric stimulator. Acoustic intensities ISPTA (spatial-peak temporal-average) was 561.9 mW/cm2 and ISPPA (spatial-peak pulse-average) was 3.9 W/cm2 (Mechanical Index, MI was 0.26). b Maximum harvested piezoelectric pulse voltage from all healthy rats (n = 5). Maximum pES voltage was found to be stable for the first 3 weeks after implantation. Scar tissue formation and change in acoustic impedance might be the cause of the decreased piezoelectric voltage. c Comparisons between conventional electrical stimulation (ES) and pES threshold voltages to activate L2 and S1 spinal cord segments (both anodic: current from L2 to S1, and cathodic: current from S1 to L2). No significant difference was found in the threshold voltages between ES and pES for either anodic or cathodic stimulations. d Trends of ES and pES voltage thresholds over 3 weeks post-implantation in one intact rat. Both stimulation thresholds tend to increase over time, but clearly followed each other (ES vs. pES)

