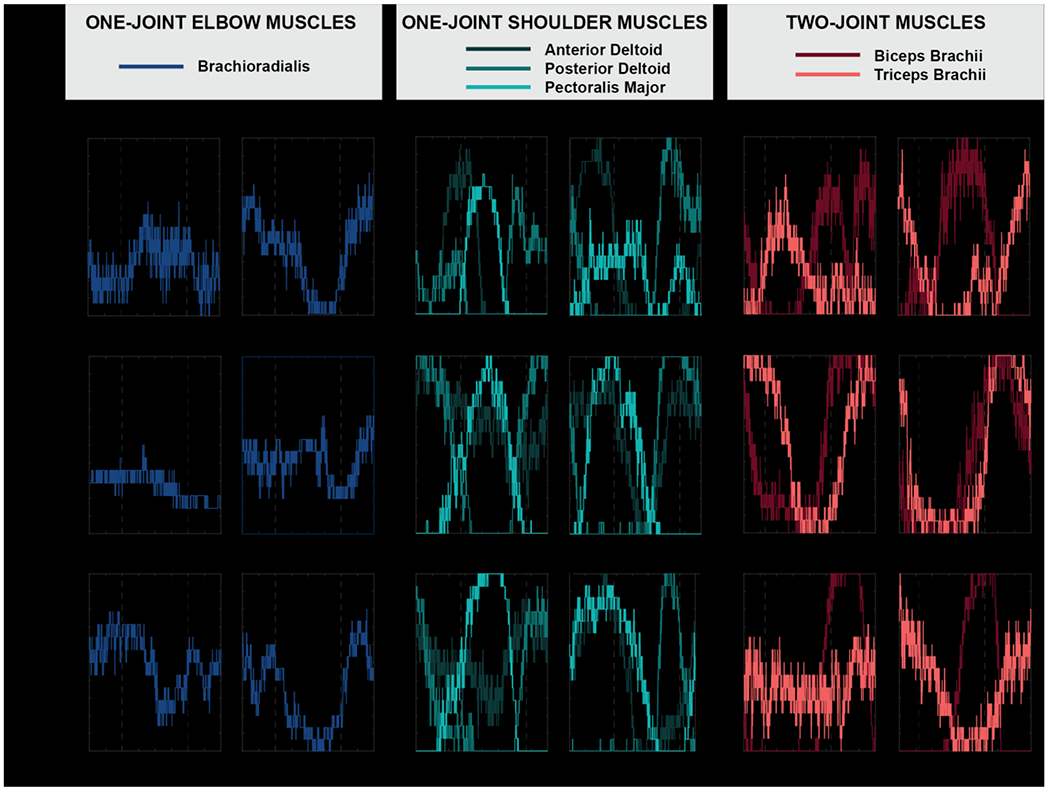
Figure 5.

Individual plots of the percentage of the revolutions where the muscle was activated for each angular position. The dotted lines indicate the muscle reversal positions specific to each muscle type. Subjects consistently did not minimize muscle activation at these points. They also exhibited different patterns of EMG activity in each movement direction.
