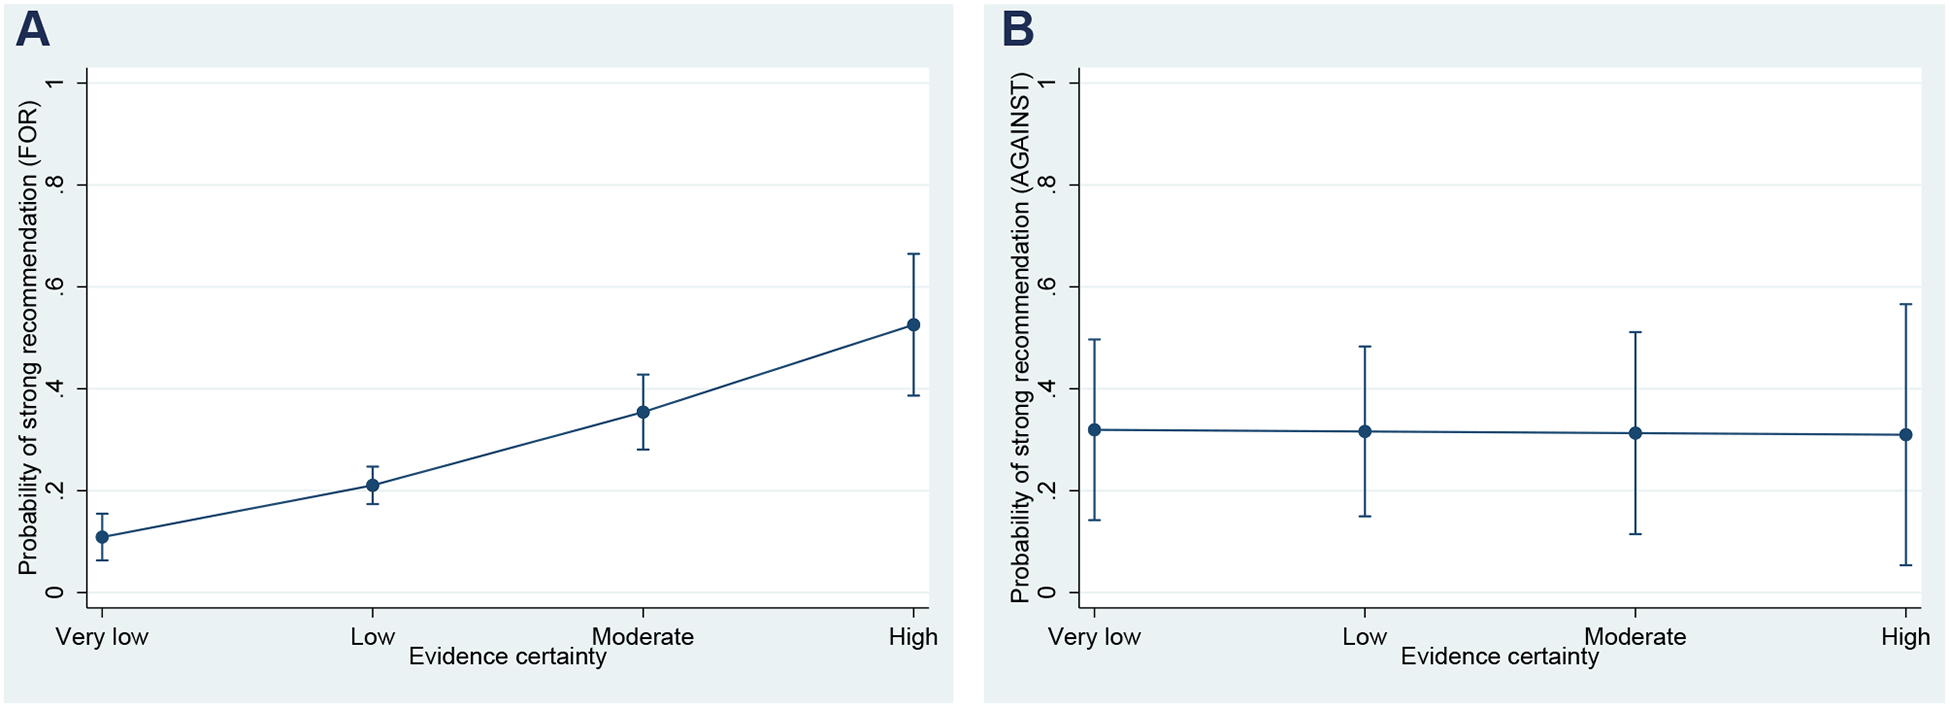
Fig. 3.

A relationship between the quality (certainty) of underlying evidence and the probability of issuing of a strong recommendation FOR (A) vs. AGAINST (B) a given health intervention. The vertical line around each point denotes a 95% confidence interval. The results remained the same even though panelists were instructed to align strength of recommendations with direction of recommendations (the reminders were originally issued orally, but it was included in the survey for the last 5 panels).
