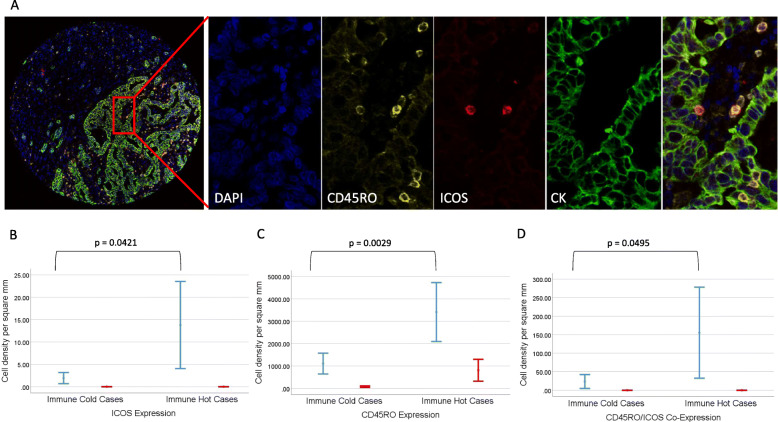
Fig. 6.
Multiplex co-expressing case displaying dual CD45RO/ICOS positive cell expression. a displays a TMA core multiplex image with an exploded view of a tumour and stromal region via individual fluorescence channels with dual labelled CD45RO/ICOS positive cells identified in the composite. b and c show graphically the assessment data for both ICOS and CD45RO, respectively, in both the tumour (blue) and stroma (red) for both ‘immune hot’ (n = 4) and ‘immune cold’ (n = 3) groups. d presents the cellular co-expression of CD45RO/ICOS positive cells within tumour (blue) and stroma (red) for both ‘immune hot’ (n = 4) and ‘immune cold’ (n = 3) groups. P values are two tailed t-tests assessing stromal biomarker expression across the two groups

