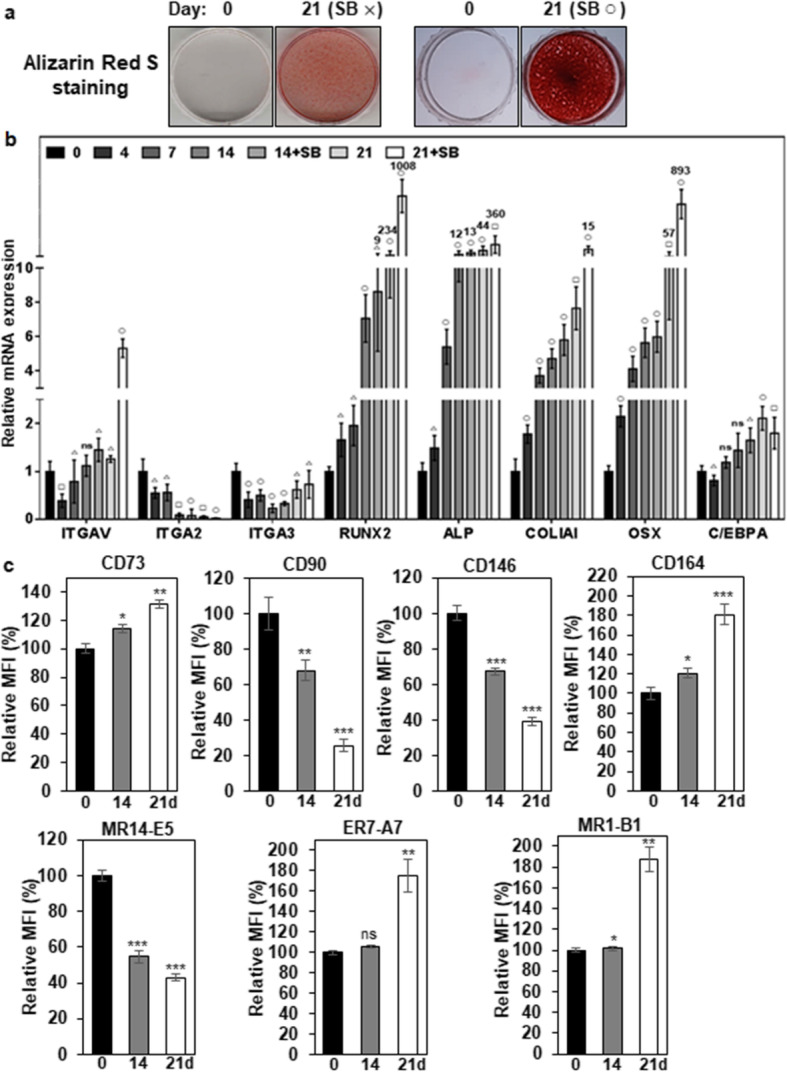
Fig. 3.

Expression changes of integrin αV, α2, α3, and osteogenic markers during differentiation of hMSCs. a Alizarin Red S staining of OBs in differentiated hMSCs. hMSCs were incubated for 21 days with ODM (SB×). To inhibit TGF-β1 signaling that originated from the culture medium, SB431542 was also included in ODM (SB○) after 7 days of osteogenic differentiation. Calcium deposition was visualized as red color after the cells were stained with Alizarin Red S. b Expression changes of integrins and osteogenic markers during osteogenic differentiation of hMSCs. Integrins (MR14-E5, ER7-A7, MR1-B1), osteogenic markers (Runx2, ALP, COL1A1, OSX), and adipogenic marker (C/EBPA) were analyzed in differentiated hMSCs by quantitative PCR. Values are depicted as a mean fold change in gene expression (2−ΔΔCT) of differentiated hMSCs at the indicated days compared to hMSCs at day 0. △, p < 0.05; □, p < 0.01; ○, p < 0.005; ns, not significant. c Expression changes of integrins and hMSC/OB surface markers during osteogenic differentiation of hMSCs. hMSCs were incubated for 21 days with ODM, and SB431542 was added to ODM after 7 days of osteogenic differentiation. Integrins (α2, α3, αV) and hMSC/OB surface markers (CD73, CD90, CD146, and CD164) were analyzed in differentiated hMSCs by flow cytometry. Values are depicted as a relative mean fluorescence intensity (MFI) of differentiated hMSCs at the indicated days compared to hMSCs cultured in normal medium. **, p < 0.01; ***, p < 0.005; ns, not significant
