
Figure 3.
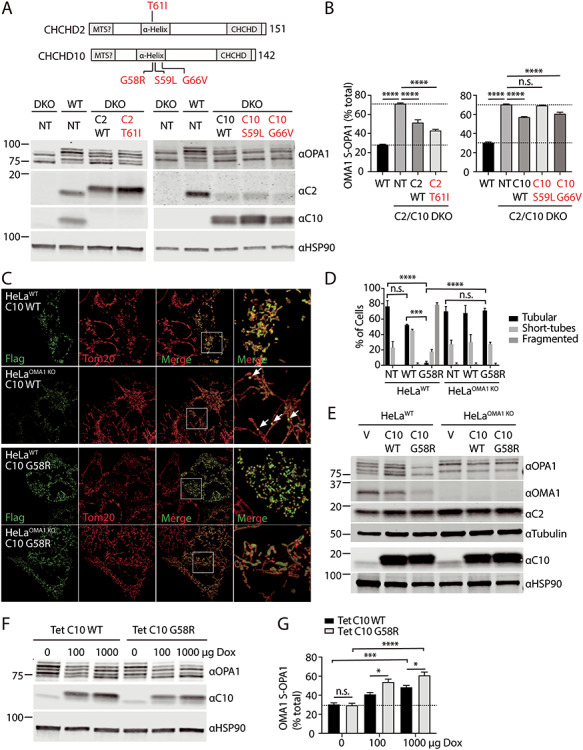
Mitochondrial fragmentation induced by C10 mutant depends on OMA1 processing of OPA1. (A and B) HEK293WT and HEK293C2/C10 DKO were not transduced (NT) or stably transduced with C10 or C2 containing the disease-causing mutations indicated. Lysates were separated on SDS-PAGE gels and OPA1 processing was assessed by immunoblotting. (B) OMA1 activity was measured as the abundance of OMA1 cleaved S-OPA1 isoforms (c and e) divided by the sum of all five isoforms in three biological replicates performed on at least two occasions. N = 3 biological replicates performed on at least two occasions. Error bars represent standard error of the mean. ****P < 0.0001 after correction for multiple comparisons. (C) Representative Airyscan confocal images of WT and OMA1 KO HeLa cells transiently transfected with C10 WT-Flag (C10 WT) or C10 G58R-Flag (C10 G58R). Anti-Flag immunostaining in green and anti-Tom20 in red. (D) Quantification of mitochondrial morphology depicted in (A) for >150 cells in three biological replicates per condition. Standard error of the mean in depicted in the graphs. ***P < 0.001 and ****P < 0.0001 after correction for multiple comparisons. Untransfected cells (NT) were identified by the absence of Flag staining in each of the samples. Counts were pooled as they did not differ among the samples. (E) Immunoblot from lysates of WT and OMA1 KO HeLa cells transduced with vector (V), C10 WT (C10 WT) or C10 G58R (C10 G58R). Tubulin and HSP90 serve as the loading controls in the respective blots. Immunoblot is representative of two biological replicates. (F and G) HeLaWT cells stably expressing tetracycline-inducible C10 WT and C10 G58R constructs were treated with 100 or 1000 μg/ml doxycycline for 48 h and whole-cell lysates were immunoblotted for OPA1, C10 and HSP90, which served as a loading control. OMA1-cleaved OPA1 was quantified as percent of the OMA1 specific isoforms (c and e) divided by the sum of all five isoforms. Experiment was performed in three biological replicates on two occasions. *P < 0.05, ***P < 0.001 and ****P < 0.0001 after correction for multiple comparisons. Error bars represent standard error of the mean. Ns, not significant.