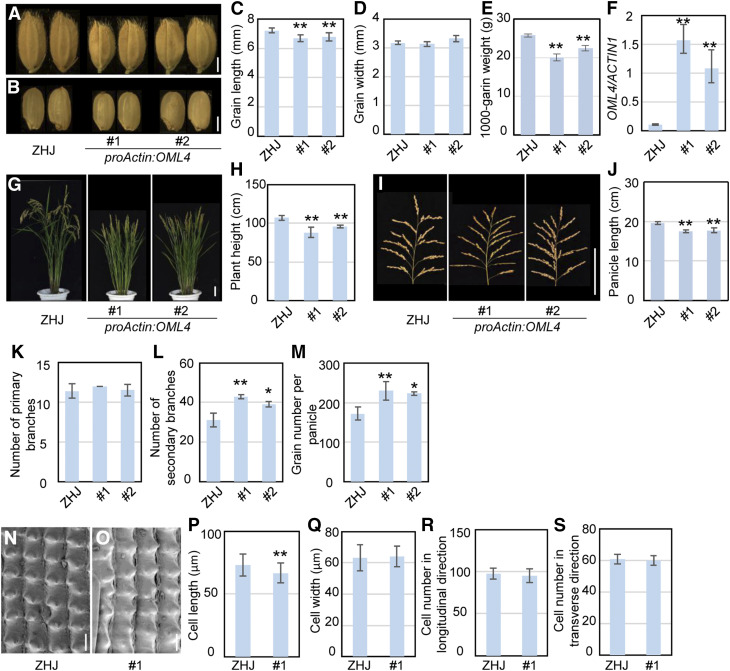
Figure 4.
Overexpression of OML4 Results in Smaller Grains.
(A) and (B) Mature paddy (A) and brown rice (B) grains of ZHJ and proActin:OML4.
(C) and (D) Grain length (C) and width (D) of ZHJ and proActin:OML4 transgenic lines.
(E) The 1000-grain weight of ZHJ and proActin:OML4 transgenic lines.
(F) Expression level of OML4/LARGE1 in ZHJ and proActin:OML4 transgenic lines. RT-qPCR was used to measure expression levels of OML4/LARGE1. Three biological replicates were used (n = 3). ACTIN1 was used to normalize expression.
(G) ZHJ and proActin:OML4 plants.
(H) Plant height of ZHJ and proActin:OML4 transgenic lines.
(I) ZHJ and proActin:OML4 panicles.
(J) Panicle length of ZHJ and proActin:OML4 transgenic lines.
(K) and (L) Primary (K) and secondary (L) panicle branch number of ZHJ and proActin:OML4 transgenic lines.
(M) Total grain number per panicle of ZHJ and proActin:OML4 transgenic lines.
(N) and (O) Scanning electron microscopy analysis of the outer surface of ZHJ (N) and proActin:OML4 #1 (O) lemmas.
(P) and (Q) Average length (P) and width (Q) of outer epidermal cells in the longitudinal direction in ZHJ and proActin:OML4 #1 lemmas.
(R) and (S) Number of outer epidermal cells in the longitudinal (R) and transverse (S) direction in ZHJ and proActin:OML4 #1 lemmas.
Values (see [C] to [E] and [P] to [S]) are given as the means ± sd (n ≥ 50). Values (see [F]) are given as the mean ± sd. Values (see [H] and [J] to [M] are given as the means ± sd (n = 20). Asterisks indicate significant differences between ZHJ and proActin:OML4 transgenic lines. *, P < 0.05; **, P < 0.01 compared with the wild type by Student’s t test.
Bar in (A) and (B) = 2 mm; bar in (G) and (I) = 10 cm; bar in (N) and (O) = 50 µm.

