Figure 8.
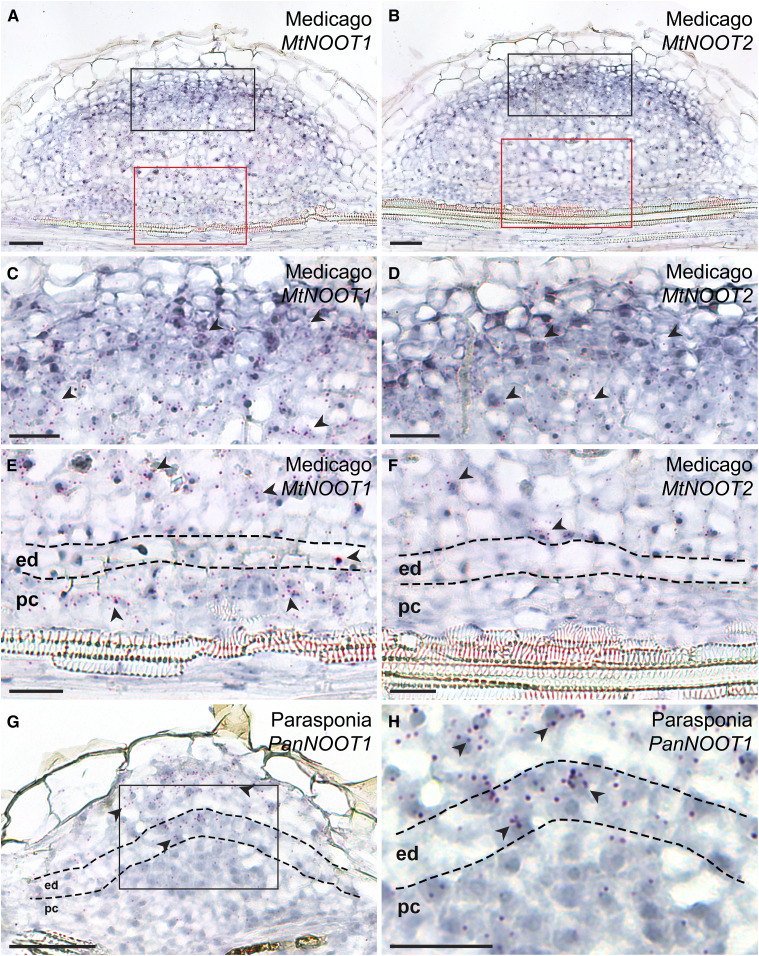
The Expression Patterns of MtNOOT1, MtNOOT2, and PanNOOT1 in Nodule Primordia.
(A) and (B) Adjacent sections of a single Medicago nodule primordium, showing the expression pattern of MtNOOT1 and MtNOOT2, respectively.
(C) and (E) The black and red boxed region in the section shown in (A), respectively.
(D) and (F) The black and red boxed region in the section shown in (B), respectively.
(A), (C), and (E) MtNOOT1 is expressed in the developing nodule meristem and infected cells (C). MtNOOT1 is also expressed in the pericycle- and endodermis-derived cells in nodule primordia (E).
(B), (D), and (F) MtNOOT2 is expressed in the developing nodule meristem and infected cells (D), but not in the pericycle- or endodermis-derived cells in nodule primordia (F).
(G) and (H) PanNOOT1 transcripts are predominately present in the infected cells and developing nodule meristem but barely detectable in the pericycle-derived cells in nodule primordia. (H) A magnification of the boxed region in (G). Red dots represent mRNA transcripts, and some are indicated by arrowheads. Dotted line marks the border between different cell types. ed, Endodermis; pc, pericycle. Scale bars, 50 µm ([A], [B], and [G]), 25 µm ([C] to [F], and [H]).

