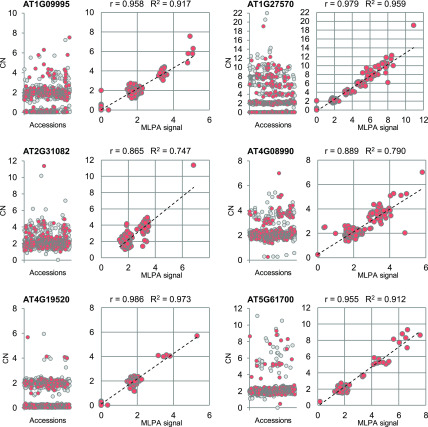
Figure 7.
Experimental Validation of Read Depth–Based Copy Number Genotyping Results.
For each CNV-gene, two scatterplots are presented: read depth–based copy numbers (CN) for 1060 accessions (left) and the correlation of the genotype data with the MLPA results for 314 accessions (right). The same set of accessions was used in all MLPA experiments, which are labeled in red in the plots on the left. The MLPA results were scaled for each CNV-gene using Col-0 signal as a reference value (CN = 2). R, Pearson correlation coefficient; R2, coefficient of determination of linear regression.

