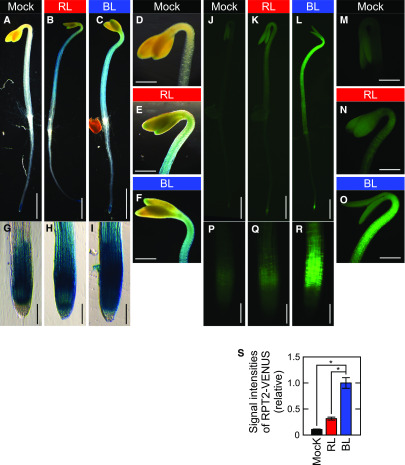
Figure 5.
Expression Patterns of RPT2pro:GUS and RPT2pro:RPT2-VENUS.
Two-day-old etiolated seedlings were not irradiated (Mock: see [A], [D], [G], [J], [M], and [P]) or irradiated with either red light (RL: see [B], [E], [H], [K], [N], and [Q]) or blue light (BL: see [C], [F], [I], [L], [O], and [R]) at 10 µmol m–2 s–1 for 4 h. Bar in (A) to (C) and (J) to (L) = 1.0 mm; bar in (D) to (F) and (M) to (O) = 400 µm; bar in (G) to (I) and (P) to (R) = 100 µm.
(A) to (I) GUS staining patterns of the wild-type seedlings transformed with RPT2pro:GUS.
(J) to (R) VENUS fluorescent images of the rpt2 mutants transformed with RPT2pro:RPT2-VENUS.
(S) Signal intensities of RPT2-VENUS fluorescence. Fluorescent signals were measured in the upper region of the hypocotyls and calculated relative to the value from BL-irradiated seedlings. The data shown are the mean values ± se from nine seedlings. Asterisks indicate statistically significant differences compared with mock seedlings (two-tailed Student’s t test, P < 0.05; Supplemental File).

