
FIGURE 1.
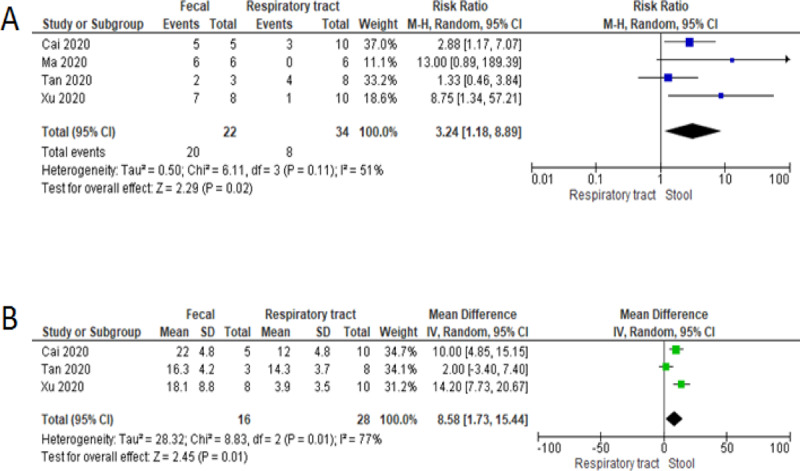
Forest plot showing the risk of persistent viral shedding in fecal samples compared to respiratory tract swabs (A) and mean difference in duration of shedding between samples (B).
Official websites use .gov
A
.gov website belongs to an official
government organization in the United States.
Secure .gov websites use HTTPS
A lock (
) or https:// means you've safely
connected to the .gov website. Share sensitive
information only on official, secure websites.
Forest plot showing the risk of persistent viral shedding in fecal samples compared to respiratory tract swabs (A) and mean difference in duration of shedding between samples (B).