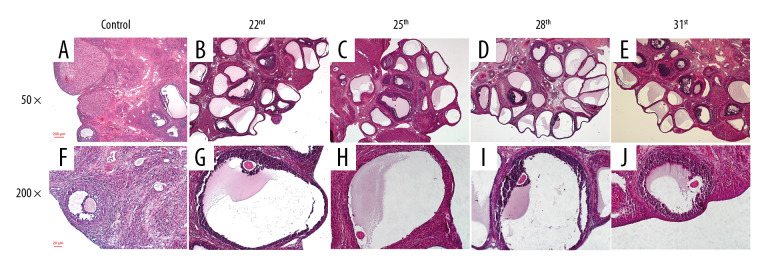
Figure 3.
The change of rat ovarian tissue pathological in the 2 groups. (A) 50×, the ovarian of rats in the control group on Day 31; (B) 50×, the ovarian of rats in the model group on Day 22. (C) 50×, the ovarian of rats in the model group on Day 25; (D) 50×, the ovarian of rats in the model group on Day 28; (E) 50×, the ovarian of rats in the model group on Day 31; (F) 200×, the ovarian of rats in the control group on Day 31; (G) 200×, the ovarian of rats in the model group on Day 22; (H) 200×, the ovarian of rats in the model group on Day 25; (I) 200×, the ovarian of rats in the model group on Day 28; (J) 200×, the ovarian of rats in the model group on Day 31.

