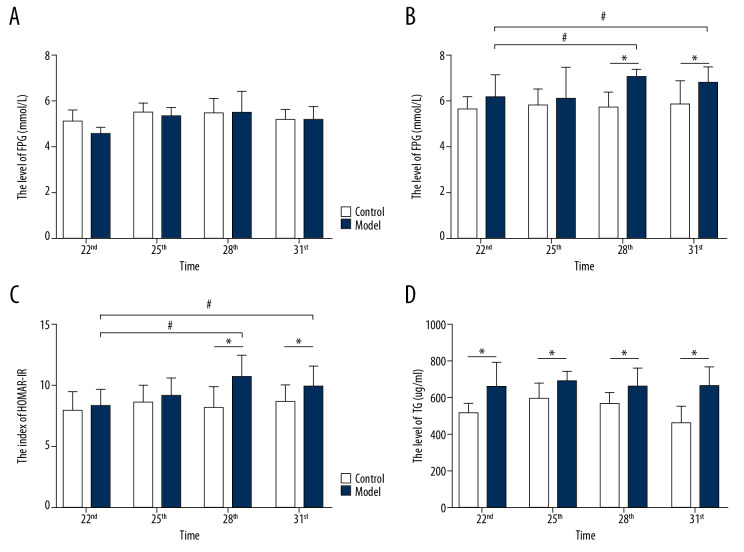
Figure 5.
The levels of FPG, FINS, HOMA-IR and TG in rat serum. (A) The level of FPG in rats between the 2 groups; (B) The level of FINS in rats between the 2 groups; (C) The index of HOMA-IR in rats between the 2 groups; (D) The level of TG in rats between the 2 groups; number, n=6, mean±standard deviation, * P<0.05 versus control; # P<0.05 versus Day 22. FPG – fasting plasma glucose; FINS – fasting insulin; TG – triglyceride.

