. 2020 Jun 3;128(6):067001. doi: 10.1289/EHP5842

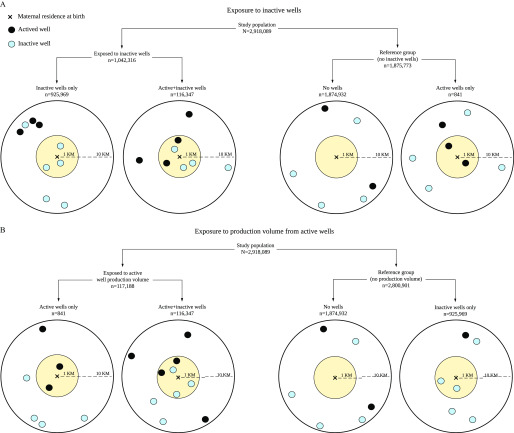
Figure 2.

Figures 2(a) and 2(b) are schematics titled exposure to inactive wells and exposure to production volume from active wells, respectively. In the schematics, study population n equals 2,918,089 is divided into two main parts, namely, exposed to inactive wells n equals 1,042,316 and reference group (no inactive wells) n equals 1,875,773 and exposed to active well production volume n equals 117,188 and reference group (no production volume) n equals 2,800,901, respectively. Exposed to inactive wells n equals 1,042,316 and Reference group (no inactive wells) n equals 1,875,773 are further divided into two sub parts, namely, Inactive wells only n equals 925,969 and active plus inactive wells n equals 116,347 and no wells n equals 1,874,932 and active wells only n equals 841, respectively, and Exposed to active well production volume n equals 117,188 and Reference group (no production volume) n equals 2,800,901 are further divided into two sub parts, namely, active wells only n equals 841 and active plus inactive wells n equals 116,347 and No wells n equals 1,874,932 and Inactive wells only n equals 925,969, respectively. Each of these sub parts are represented by a smaller circle placed inside a larger, having radius of 1 kilometer and 10 kilometers, respectively, and showcasing the areas with Maternal resistance at birth, actived wells, and inactive wells.

Schematic of definition of exposure and reference groups for inactive well count (A) and active well production volume (B). For each exposure metric, exposure was based on the presence of inactive or active wells within the 1 km buffer. Observations without the specific well type for each metric were assigned into the reference category.