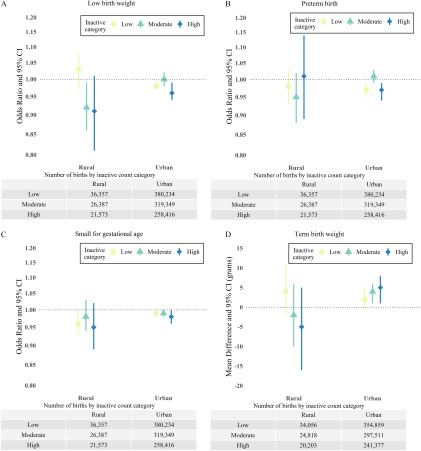
Figure 3.
Plots of rural vs. urban odds ratios or mean difference in birth weight (grams) and 95% confidence interval (CI) for associations between exposure to low, moderate, and high counts of inactive wells across the entire pregnancy and low birth weight (A), preterm birth (B), small for gestational age (C), and continuous term birth weight (D). Logistic regression models adjust for inactive well count, child’s sex, birth month and birth year, and maternal education, age, race/ethnicity, Kotelchuck prenatal care index, parity, air basin, and ICE for income. In addition to the covariates adjusted for in the logistic regression models, the linear regression models also adjusted for gestational age. All y-axes are on the logarithmic scale except for on the term birth weight plot. Numerical values plotted here can be found along with estimates for the three trimesters and p-values for statistical tests for effect modification in Tables S1–S2.

