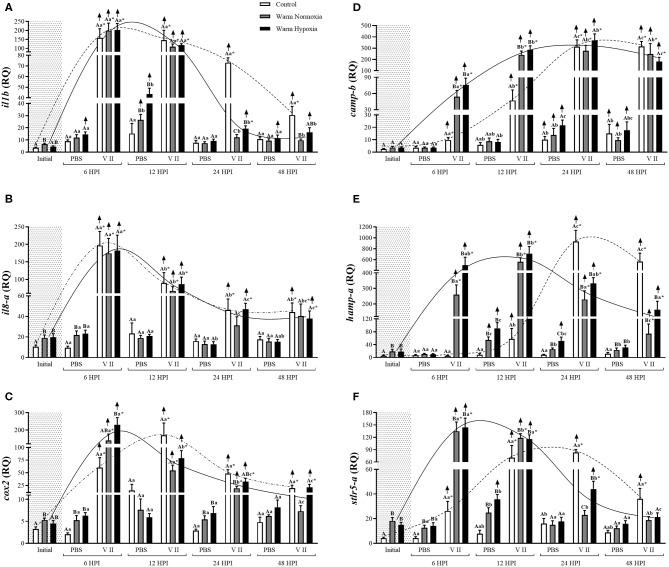
Figure 2.
Transcript expression levels of 6 anti-bacterial biomarkers [il1b (A), il8-a (B), cox2 (C), camp-b (D), hamp-a (E), and stlr5-a (F)] in the head kidney of salmon held at 12°C (under normoxia) or 20°C (under normoxia or mild hypoxia) (i.e., treatment) 6, 12, 24, and 48 h post-intraperitoneal injection with PBS or Forte V II (i.e., group). Different capital letters indicate a significant difference (P < 0.05) among treatments within an injection group at a given time point (e.g., the three treatments six HPI after PBS injection) whereas dissimilar lower case letters indicate a significant difference over time within a treatment/group (e.g., control PBS-injected fish at 6, 12, 24, and 48 HPI). An asterisk (*) indicates a significant difference between PBS and Forte V II fish within a treatment at the same time point post-injection. The arrows indicate a significant difference compared with initial (constitutive expression) levels, within an injection group. Dotted (control) or solid lines (warm normoxia and hypoxia) illustrate the general pattern of changes in transcript expression levels for a given gene over time in Forte V II-injected fish, and are not based on any mathematical analysis. Transcript levels are presented as mean ± SE relative quantity (RQ) values (i.e., values for the transcript of interest were normalized to both etif3d and pabpc1 transcript levels and were calibrated to the individual with the lowest normalized expression level of that given transcript). N = 7–8.

