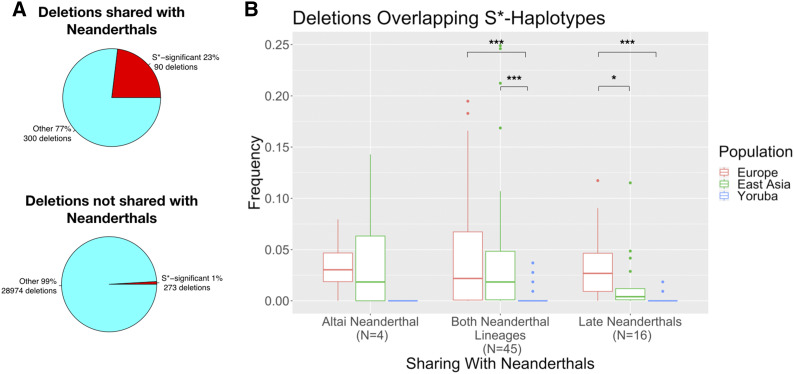
Figure 4.
Enrichment for introgression and population differentiation of human polymorphic deletion variants shared with Neanderthals. (A) Pie charts show the proportion of deletion variants found (red) and not found (light blue) in S*-significant introgressed haplotypes. Pie charts for deletion variants shared and not shared with Neanderthals are shown above and below, respectively. (B) Frequencies of deletion variants overlapping S*-significant putatively introgressed haplotypes in European, East Asian, and Yoruba populations included in the 1000 Genomes Project data set Phase III release. x-Axis shows with which Neanderthal lineage the deletion variants are shared. Note that the deletion variants shared with Altai and late Neanderthal lineages are exclusively shared with those lineages. Significant frequency differences between populations are shown with asterisks on the top of the plots. * P < 0.05, ** P < 0.01, *** P < 0.001.

