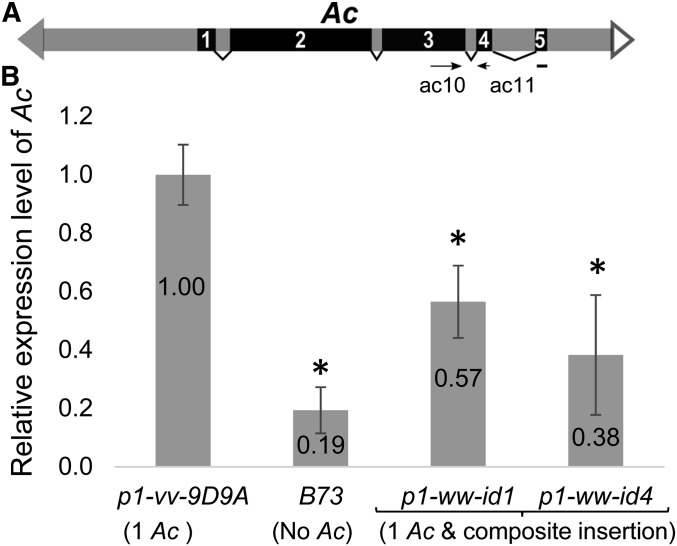
Figure 4.
The Ac transcript level is decreased in p1-ww-id alleles. (A) Schematic structure of the full-length Ac transposable element. Solid and open triangles indicate Ac 5′ and 3′ termini, respectively. Black boxes with numbers are Ac exons 1–5; boxes with subtending lines indicate introns. Primers used in the quantitative RT PCR (ac10 and ac11) are labeled as arrows; note that primer ac11 spans Ac intron 4. (B) Quantitative RT-PCR measurement of Ac transcript levels. Bars labeled by * indicate transcript levels that are significantly different from p1-vv-9D9A by Student’s unpaired t-test with P < 0.05.

