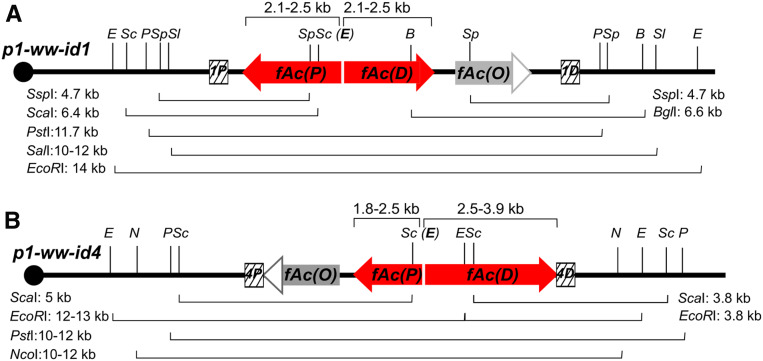
Figure 5.
Summary of Southern blot results that elucidate the internal structures of Composite Insertions. Schematic structures of p1-ww-id1 and p1-ww-id4 are shown in A and B, respectively, with restriction sites (vertical lines; E: EcoRI; Sc: ScaI; P: PstI; Sp: SspI; Sl: SalI; B: BglI; N: NcoI) and probes (hatched boxes) shown. Bands observed from Southern blot (Figures S3 and S4) are indicated by braces with actual sizes labeled by each restriction enzyme.

