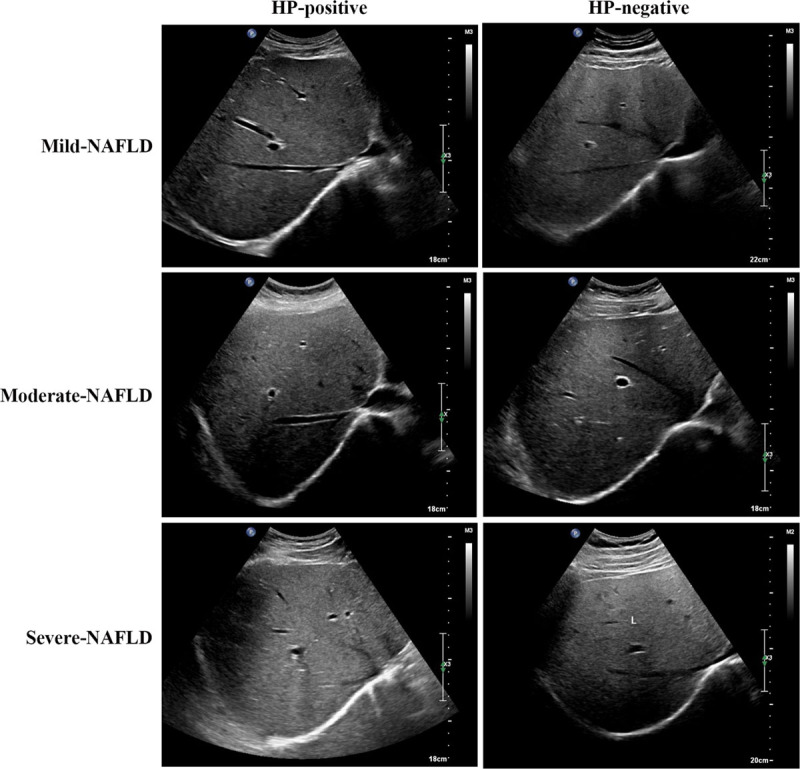
Fig. 1.

Representative B-mode ultrasonography image maps of different NAFLD patients. The white background represents steatosis tissues, and the black piping shadow represents intrahepatic ducts. The white standard measurement bar on the top right corner is used for evaluating the brightness of the white background.NAFLD, nonalcoholic fatty liver disease.
