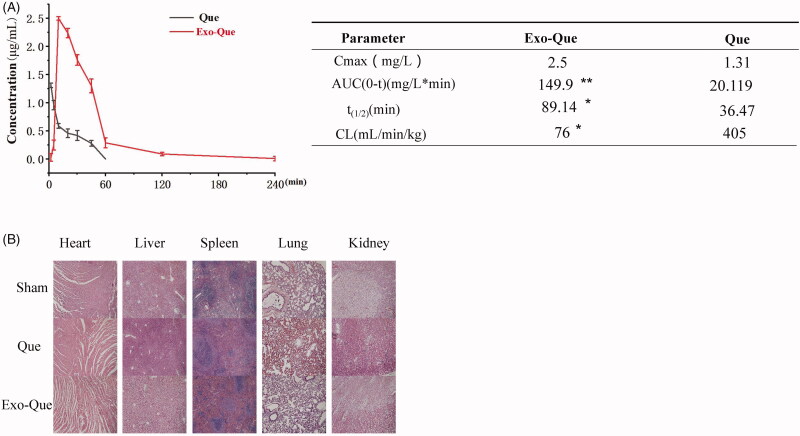
Figure 4.
Exo-Que enhanced the bioavailability of Que in vivo. (A) The plasma concentration–time curve and fitted PK parameters of Que and Exo-Que after single i.v. administration of Que and Exo-Que at the concentration of Que (12 mg/kg). Data are expressed as means ± SD (n = 3). *p < 0.05 and **p < 0.01. (B) H&E staining of heart, liver, spleen, lung, and kidney tissue sections of rats at 7 day after i.v. daily administering a single dose of 1 mL of saline and 1 mL of various Que formulations at 12 mg/kg. The scale bar is 200 μm and applies to all figure parts.

