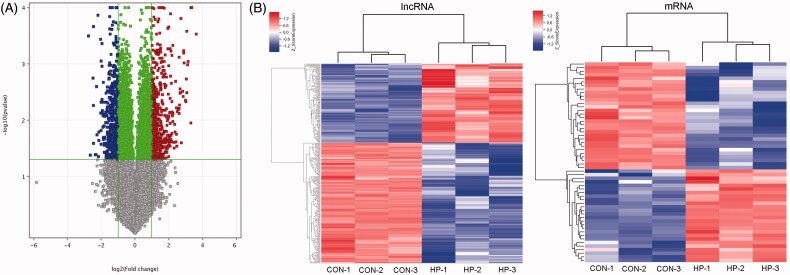
Figure 2.
Cluster analyses the different expression of mRNAs and lncRNAs. (A) Volcano plot analysis of group CON vs. HP. The Volcano plots contain differentially expressed mRNAs and lncRNAs and illustrate the complete of mRNAs and lncRNAs. The abscissa represents the difference between the two data sets following log 2 conversion and the ordinate represents the -log10 (p-value); (B) Hierarchical clustering analyses of differentially expressed lncRNAs and mRNAs.

