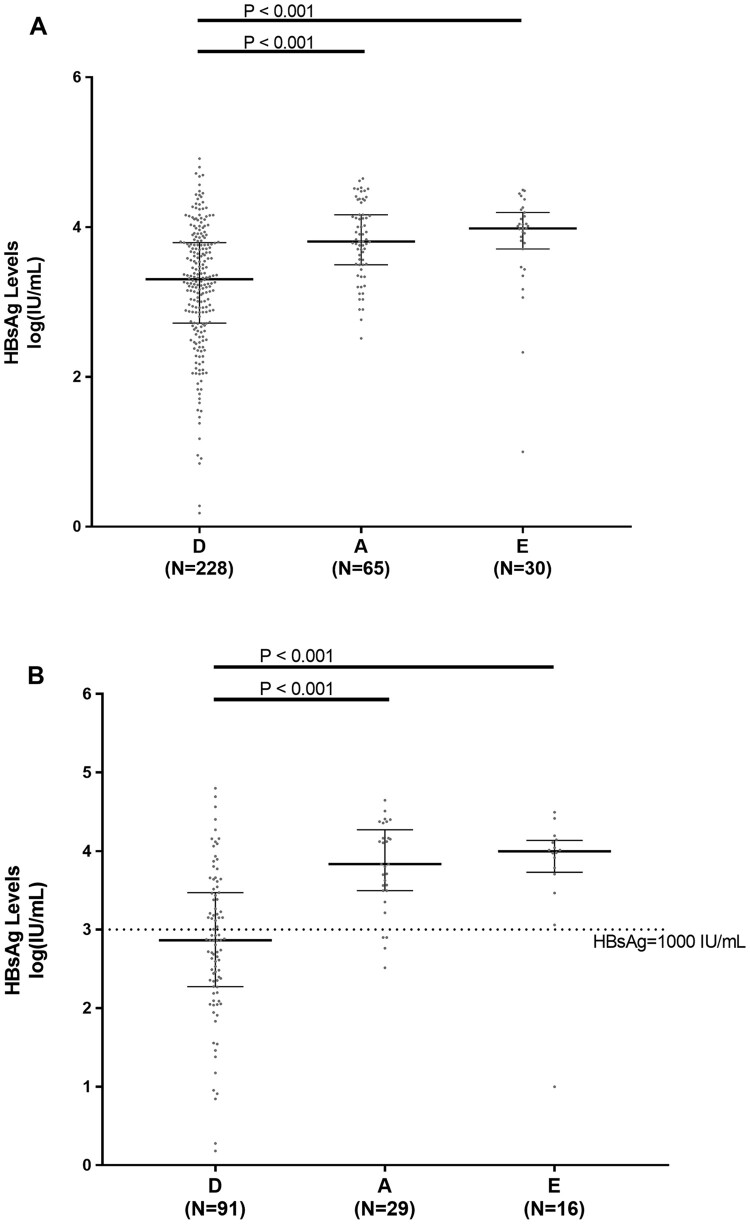
Figure 1.
HBsAg levels in HBV genotypes D, A and E. Scatter plots report the distribution of HBsAg levels in the overall population of HBeAg-negative patients (N=228 for genotype D, N=65 for A and N=30 for E) (A) and in patients with persistent serum HBV-DNA<2,000IU/ml and normal ALT (N=91 for D, N=29 for A and N=16 for E) (B). Statistically significant differences were assessed by Mann-Whitney test. Bars represent median, 25th and 75th percentile.

