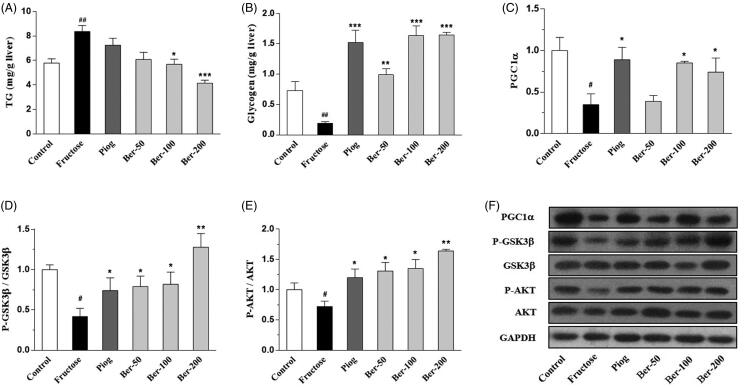
Figure 3.
The effects of berberine on hepatic TG and glycogen content in fructose-fed mice. (A) Hepatic TG content; (B) hepatic glycogen content; (C) the protein expression of PGC1? in liver; (D) The protein expression of GSK? in liver; (E) the protein expression of AKT in liver; (F) the immunoblot bands. Data were expressed as the mean ± S.E.M. (n = 10 for TG and glycogen; n = 6 for WB). #p < 0.05, ##p < 0.01 vs. control group. *p < 0.05, **p < 0.01, ***p < 0.001 vs. fructose group.

