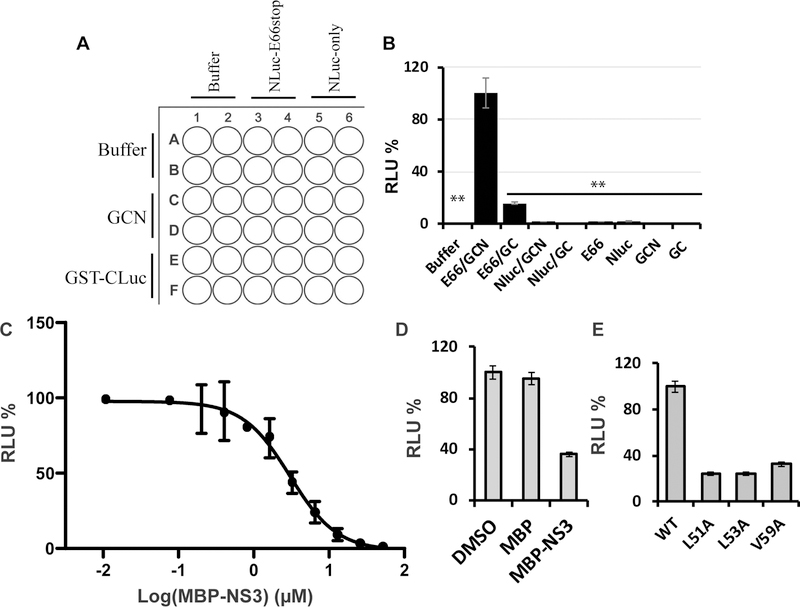
Figure 3. SLC Assay specificity.
(A) Experimental design using 96-well plate. (B) Relative luminescence unit (RLU) generated by each pair of binding partners or controls. Equal concentrations (100 nM) of each pair of NS2B/NS3 constructs or controls (or alone) were mixed and incubated with luciferin substrate. **P < 0.001. In all bar graphs, means and SDs from triplicate experimental data were shown, unless otherwise specified. (C) Dose-response inhibition of the SLC signals from NLuc-E66stop and GCN by “cold” MBP-NS3. Experimental data were fitted using the sigmoidal function with Prism GraphPad 8.1 software. (D) The DENV2 MBP-NS3 fusion protein specifically inhibited the SLC by NLuc-E66stop and GCN (80 nM each). MBP-NS3 or MBP were at 3.25 μM each. **P < 0.001. (E) NS2B mutations greatly reduced SLC. GCN was paired with equal molar of NLuc-E66stop or NLuc-E66stop mutants (L51A, L53A, and V59A). **P < 0.001. Figure is modified from Figure 2 in Li et al. (Li et al., 2017).

