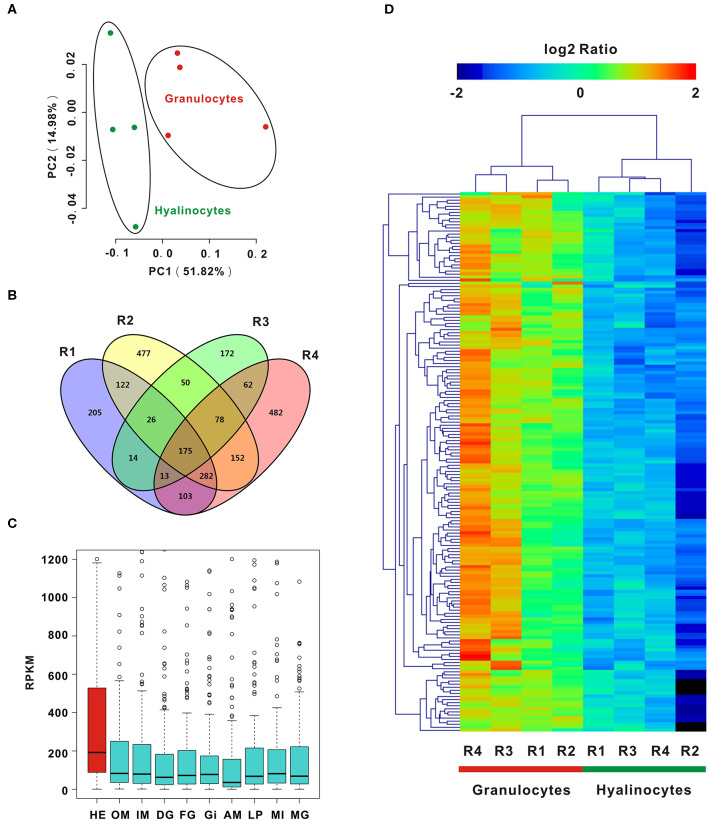
Figure 2.
PCA and DEGs analysis of C. gigas granulocytes and hyalinocytes. (A) Scores plot of principal components analysis on C. gigas hemocyte subpopulations (granulocytes and hyalinocytes). PC1 and PC2: principal component 1 and principal component 2. Each point represents a metabolite profile of a biological replicate. (B) DEGs were first explored in each group for comparison between granulocytes and hyalinocytes. Venn diagram was constructed to determine common DEGs in the four groups (R1, R2, R3, and R4). (C) Tissue distribution of DEGs in C. gigas. Red box represents the high expression of DEGs in hemocytes. HE, hemocytes; OM, outer mantle; IM, inner mantle; DG, digestive grand; FG, female gonad; GI, gill; AM, adductor muscle; LP, labial palps; MI, mixture of adult tissues; MG, male gonad. (D) Data for relative expression levels of genes were obtained by DEGs data. Colors from red to blue indicate range of log2 ratio values (in descending order); red color indicates high expression level and blue color indicates low expression level.

