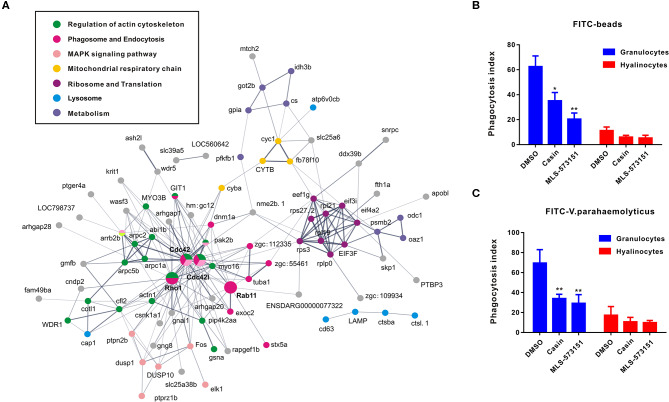
Figure 3.
Networks based on DEGs implicating central roles of Cdc42 in granulocyte phagocytosis. (A) Networks are represented here schematically. Nodes represent proteins. Edges represent interactions between proteins. Different colors represent different pathways and proteins. (B,C) Phagocytosis index of FITC beads (B) or FITC-labeled bacteria (V. pa) (C) by C. gigas granulocytes and hyalinocytes in the presence of Cdc42 inhibitors (casin and MLS-573151). Blue panel represents granulocytes and red panel represents hyalinocytes. *p < 0.05; **p < 0.01.

