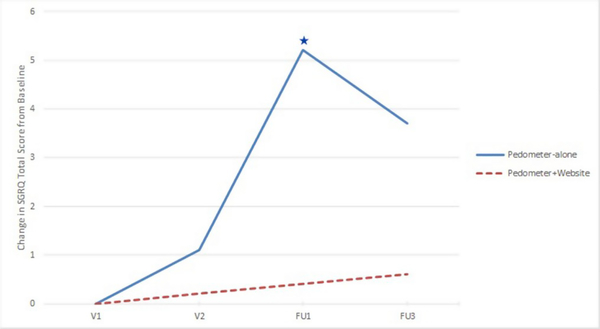
Fig. 3.
Change in Saint George’s Respiratory Questionnaire (SGRQ) total score from baseline by randomization group.
Change in St. George’ s Respiratory Questionnaire Total Score (SGRQ-TS) from baseline (V1) from adjusted regression model (least square means values). There were no significant between-group differences in change in SGRQ-TS from baseline. The blue star denotes a significant (p < 0.05) within group change in SGRQ-TS score from baseline in the pedometer-only group at FU1. (For interpretation of the references to colour in this figure legend, the reader is referred to the Web version of this article.)

