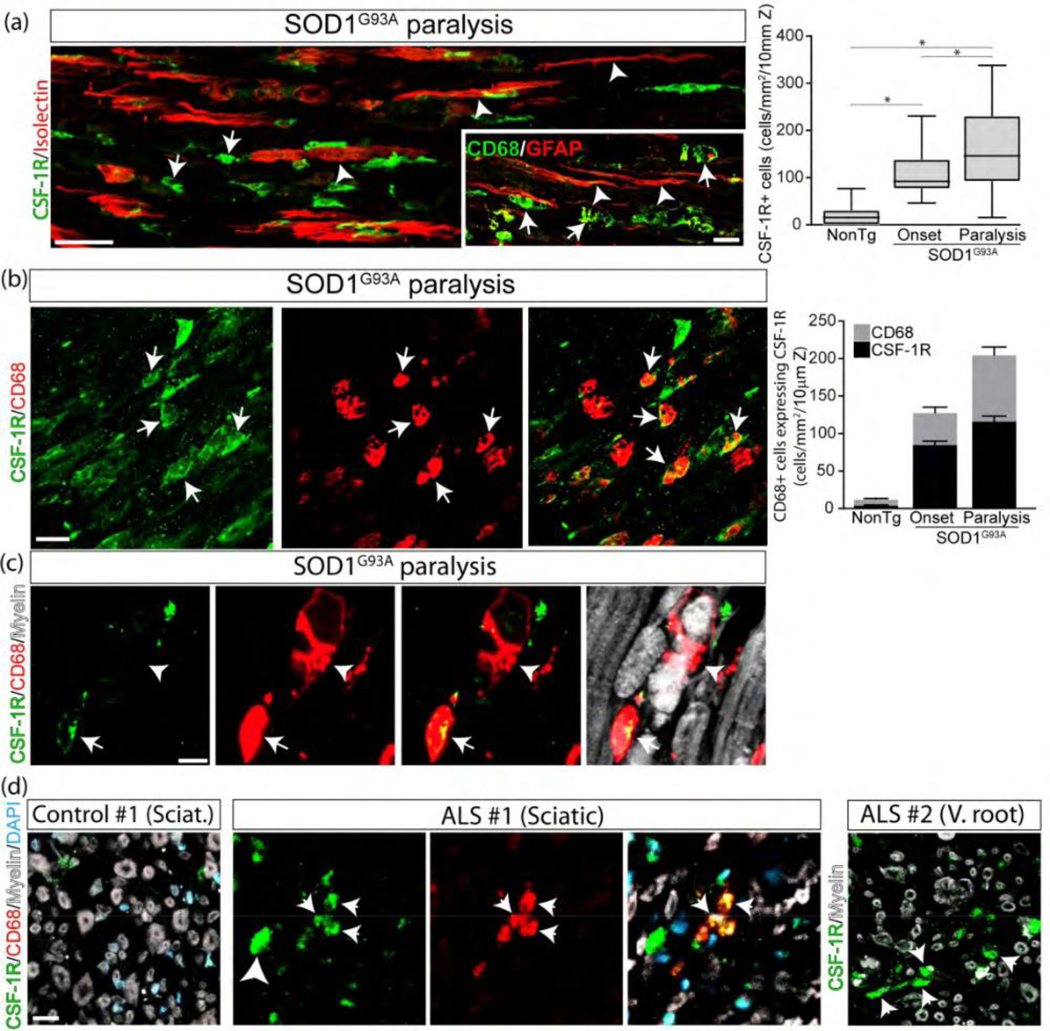
Figure 4.

SCs interact with CSF-1R+ macrophages. (a) Spatial association of denervated SCs expressing Isolectin or GFAP (white arrowheads) with CSF-1R+ and CD68+ macrophages (white arrows) in SOD1G93A rats and NonTg littermates. he graph to the right shows the quantitative analysis of CSF-1R+ cells into the sciatic nerve among conditions. (b) Identification of cells expressing CSF-1R. Note that CSF-1R+ cells mainly correspond to macrophages expressing CD68 (white arrows). The graph to the right shows the quantitative analysis of CD68+ macrophages expressing CSF-1R. (c) High magnification analysis showing a subset non-phagocytic C 68+ macrophages express CSF-1R (white arrow), while phagocytic macrophages lose CSF-1R staining (white arrowhead). (d) CSF-1R expression analysis in cross-sections of the sciatic nerve and ventral root from ALS subjects. All quantitative data are expressed as mean ± SEM; data were analyzed by Kruskal-Wallis followed by Dunn’s multiple comparison test. * indicates p < 0.05. n=4 animals/condition. Scale bars: 20 μm in (a), (b) and (d), and 10 μm in (c). 178×175mm (300 × 300 DPI)
