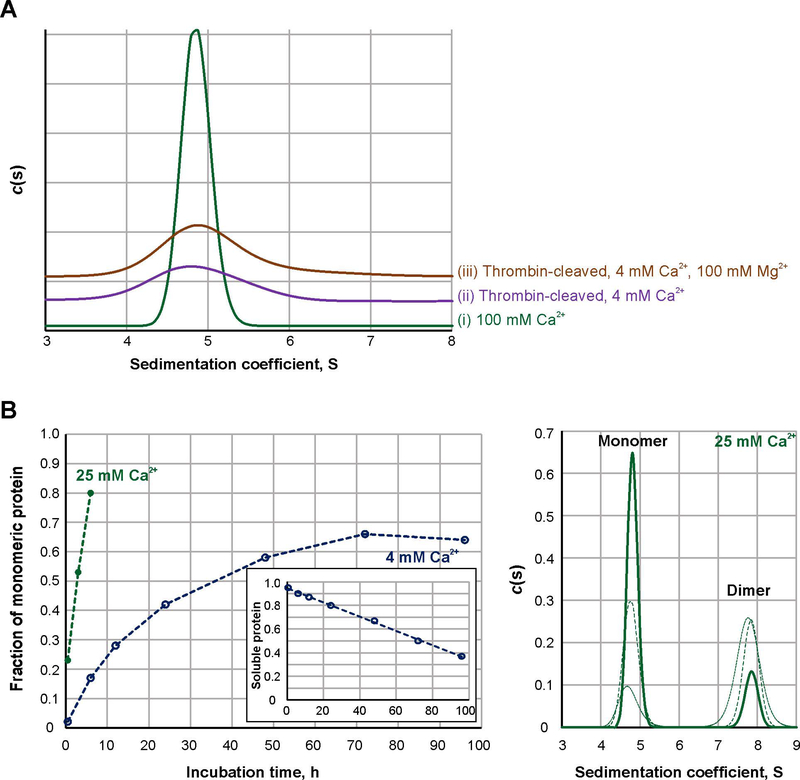
Fig. 1. Sedimentation properties and activation rate of FXIIIA under different conditions.
A – Sedimentation profiles of FXIIIA studied by AUC: 2 μM FXIIIA was activated at 37 °C for 30 min nonproteolytically by 100 mM CaCl2 (trace I, green) or proteolytically by 3.5 NIH units/ml bovine thrombin in the presence of 4 mM CaCl2 (trace ii, purple). An additional sample of thrombin-activated FXIIIA contained 4 mM CaCl2 and 100 mM MgCl2 (trace iii, orange). Two independent samples were analyzed for each condition, with the same results. (N=2)
B – Dissociation progress of 2 μM FXIIIA in the presence of 4 (open blue circles) and 25 mM CaCl2 (filled green circles). Graph on the left presents quantitative analysis of sedimentation velocity AUC data. The insert demonstrates fraction of soluble protein (estimated from absorbance at 280 nm) in samples of 4 mM Ca2+-activated FXIIIA as a function of time. The panel on the right depicts AUC sedimentation profiles for the FXIIIA samples incubated in the presence of 25 mM CaCl2 for 30 min (dotted green line), 3 h (dashed green line) and 6 h (solid green line).

