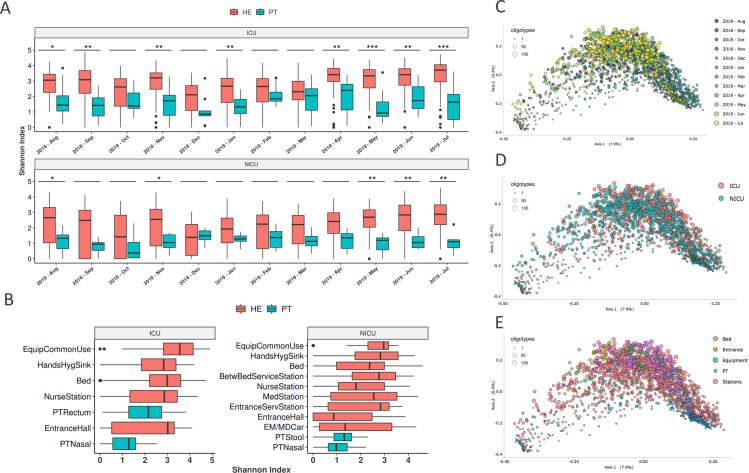
Fig 2. Hospital diversity analysis.
(A) Shannon alpha-diversity index for ICU (top panel) and NICU (bottom panel) in healthcare environment (HE) or patient (PT) samples along the year of study. Asterisks (*) above boxplots represent the statistical significance of differences between HE and PT within each month (Wilcoxon, FDR ≤ 5%; * p < 0.05, ** p < 0.01, *** p < 0.001. (B) Shannon index calculated for ICU (left) and NICU (right) collected locations. Abbreviations: Equipment common use–EquipCommonUse, Hands Hygiene Sink–HandsHygSink, Patient Rectum–PTRectum, Patient Nasal–PTNasal, Patient Stool–PTStool, Medical Station–MedStation, Emergency/Medical car–EM/MDCar. (C-E) Beta-diversity weighted UniFrac analysis were represented by PCoA plots, considering the samples groups by (C) Month—August-2018 to Jul-2019, (D) Unit—ICU and NICU and (E) Collection sites: Bed, Entrance, Equipment, Patient (PT) and Stations. None of these three groups showed a clear unique diversity profile, except for patient samples more grouped in (E)–(blue–bottom right dots). Circle sizes represent the different amount of oligotypes (unique 16S sequences—sOTUs) in the samples.

