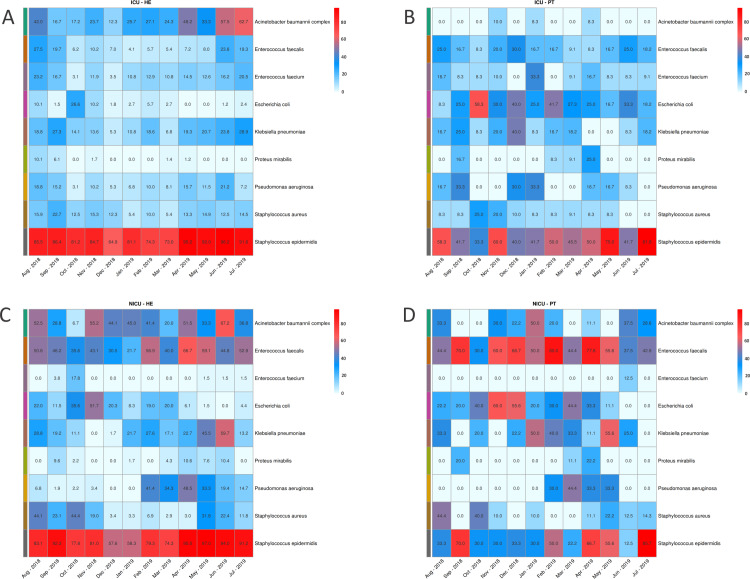
Fig 3. Bacterial proportions detected in samples along the year.
Proportions of most abundant bacteria in samples at each month for (A) ICU environment, (B) ICU patients, (C) NICU environment and (D) NICU patients. Color scales indicate the highest proportions (in red) to the lower proportions (in white).

