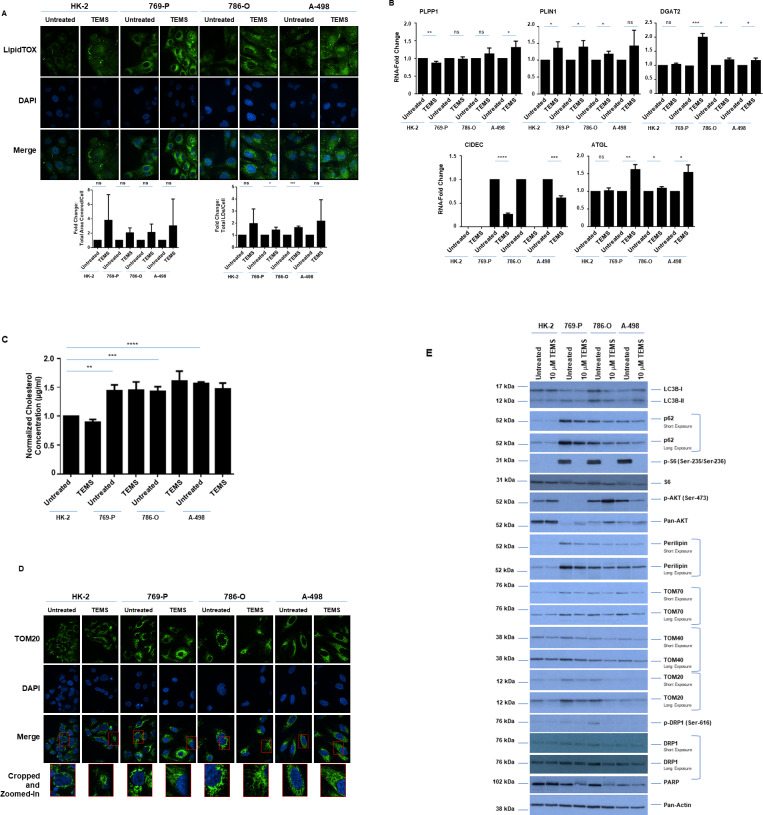
Fig 3. TEMS alters LD abundance and mitochondrial networks in malignant renal cell lines.
(A) LD assessment of ccRCC cell lines and HK-2 cells in response to 24 hour treatment with 10 μM TEMS via immunofluorescence staining using LipidTOX. Three independent experiments were performed and representative images are displayed as well as quantification of Total Area Covered/Cell and Total LDs/Cell (presented as normalized Fold-Change). (B) Real-time PCR analyses of genes involved in LD biogenesis and regulation in ccRCC cell lines and HK-2 cells in response to 24 hour treatment with 10 μM TEMS. Data shown is the composite of three independent experiments. (C) Assessment of total cholesterol levels in ccRCC cell lines and HK-2 cells in response to 72 hour treatment with 10 μM TEMS. The composite of three independent experiments is displayed. (D) Mitochondrial network assessment of ccRCC cell lines and HK-2 cells in response to 24 hour treatment with 10 μM TEMS via immunofluorescence staining of TOM20. Three independent experiments were performed and representative images are displayed. (E) Western blot analyses of ccRCC cell lines and HK-2 cells treated for 72 hours with 10 μM TEMS with the indicated antibodies. Three independent experiments were performed and representative blots are displayed.

