
Fig 3. Generic illustration of an IMU signal and the steps performed by both algorithms.
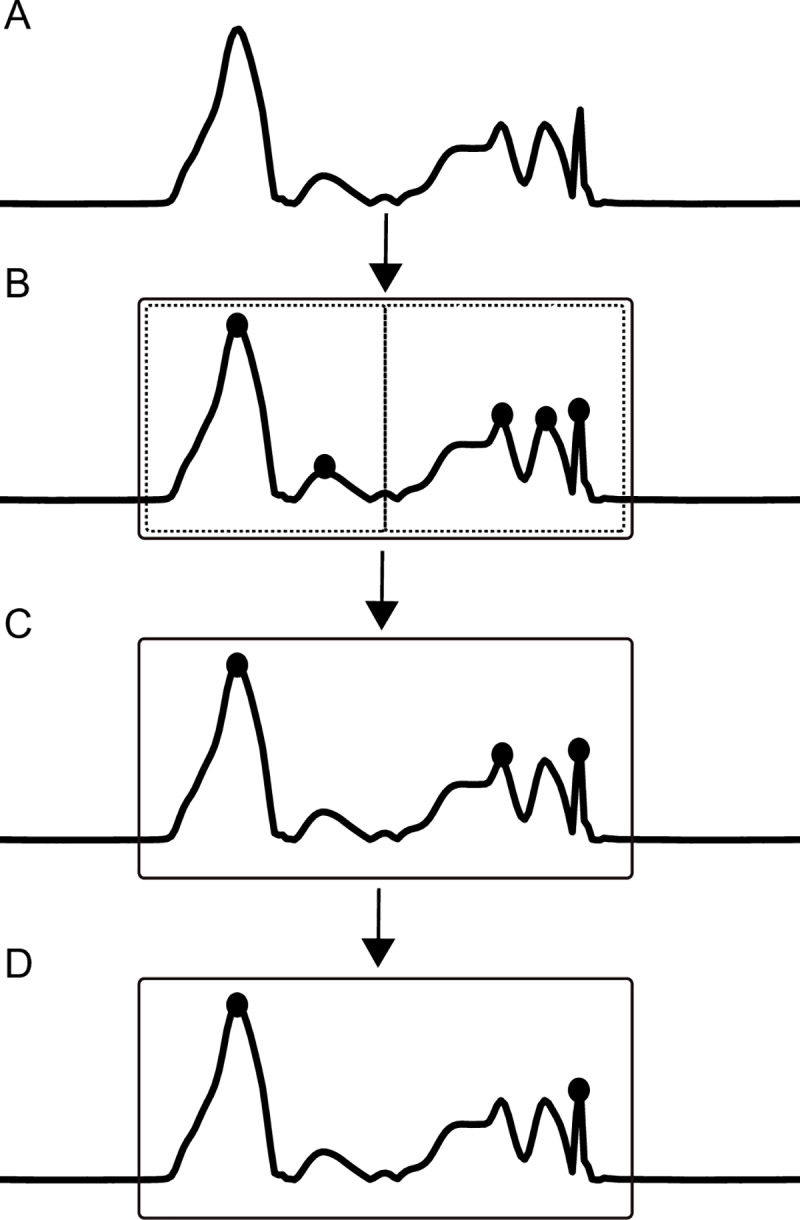
The preprocessed signal is indicated in A. The estimated swing phase is indicated with the box in B. For the angular velocity signal, the peaks within one estimated swing phase are detected (B). From these peaks, peaks were selected if the peak height or prominence was bigger than the mean peak height or prominence, or both (C). Thereafter, the peak closest to the start of the estimated swing phase was selected as the hoof-off time point and the peak closest to the end of the estimated swing phase was selected as the hoof-on time point (D). For the acceleration signal, these steps were performed for the first and second half of the estimated swing phase, indicated with the dotted boxes in B.