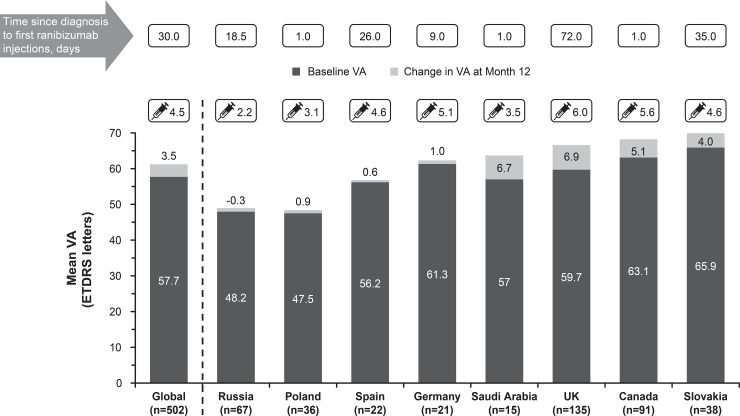
Fig 7. Mean change in visual acuity, baseline visual acuity, and average injection numbers across various regions (primary treated eye set).
The primary treated eye set included all primary treated eyes in patients included in the safety set. Top recruiting countries (treatment-naïve DME) with highest evaluable baseline and year 1 data. For the 1-year time period, all patients with non-missing baseline VA and year 1 VA performed anywhere between Day 319 and Day 409 but who had been in the study for at least 365 days from baseline to last follow-up date were included in the analysis. DME, diabetic macular edema; ETDRS, Early Treatment Diabetic Retinopathy Study; VA, visual acuity.

