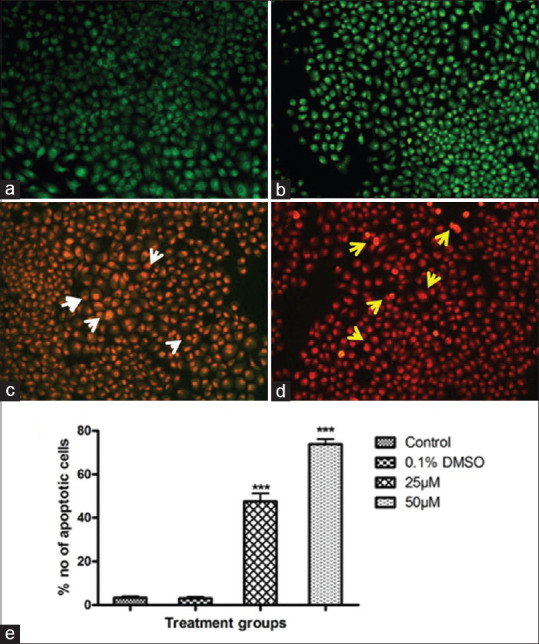
Figure 2.

Apoptosis analysis by acridine orange/ethidium bromide (×10). (a) Control; (b) dimethyl sulfoxide; (c and d) syringic acid treatments 25 and 50 μM treatments, respectively. White arrowheads show the early apoptotic cells; Yellow arrowheads show late apoptotic and DNA fragmented cells. (e) Quantification of apoptotic cells. Values are expressed as mean ± standard error of mean (n = 3). ***P < 0.001 compared to control
